GP list cleansing is taking core funding out of general practice, and it is taking it disproportionately from practices in deprived areas. Per registered patient, practices in the most deprived fifth of areas are losing twice as much as those in the least deprived.
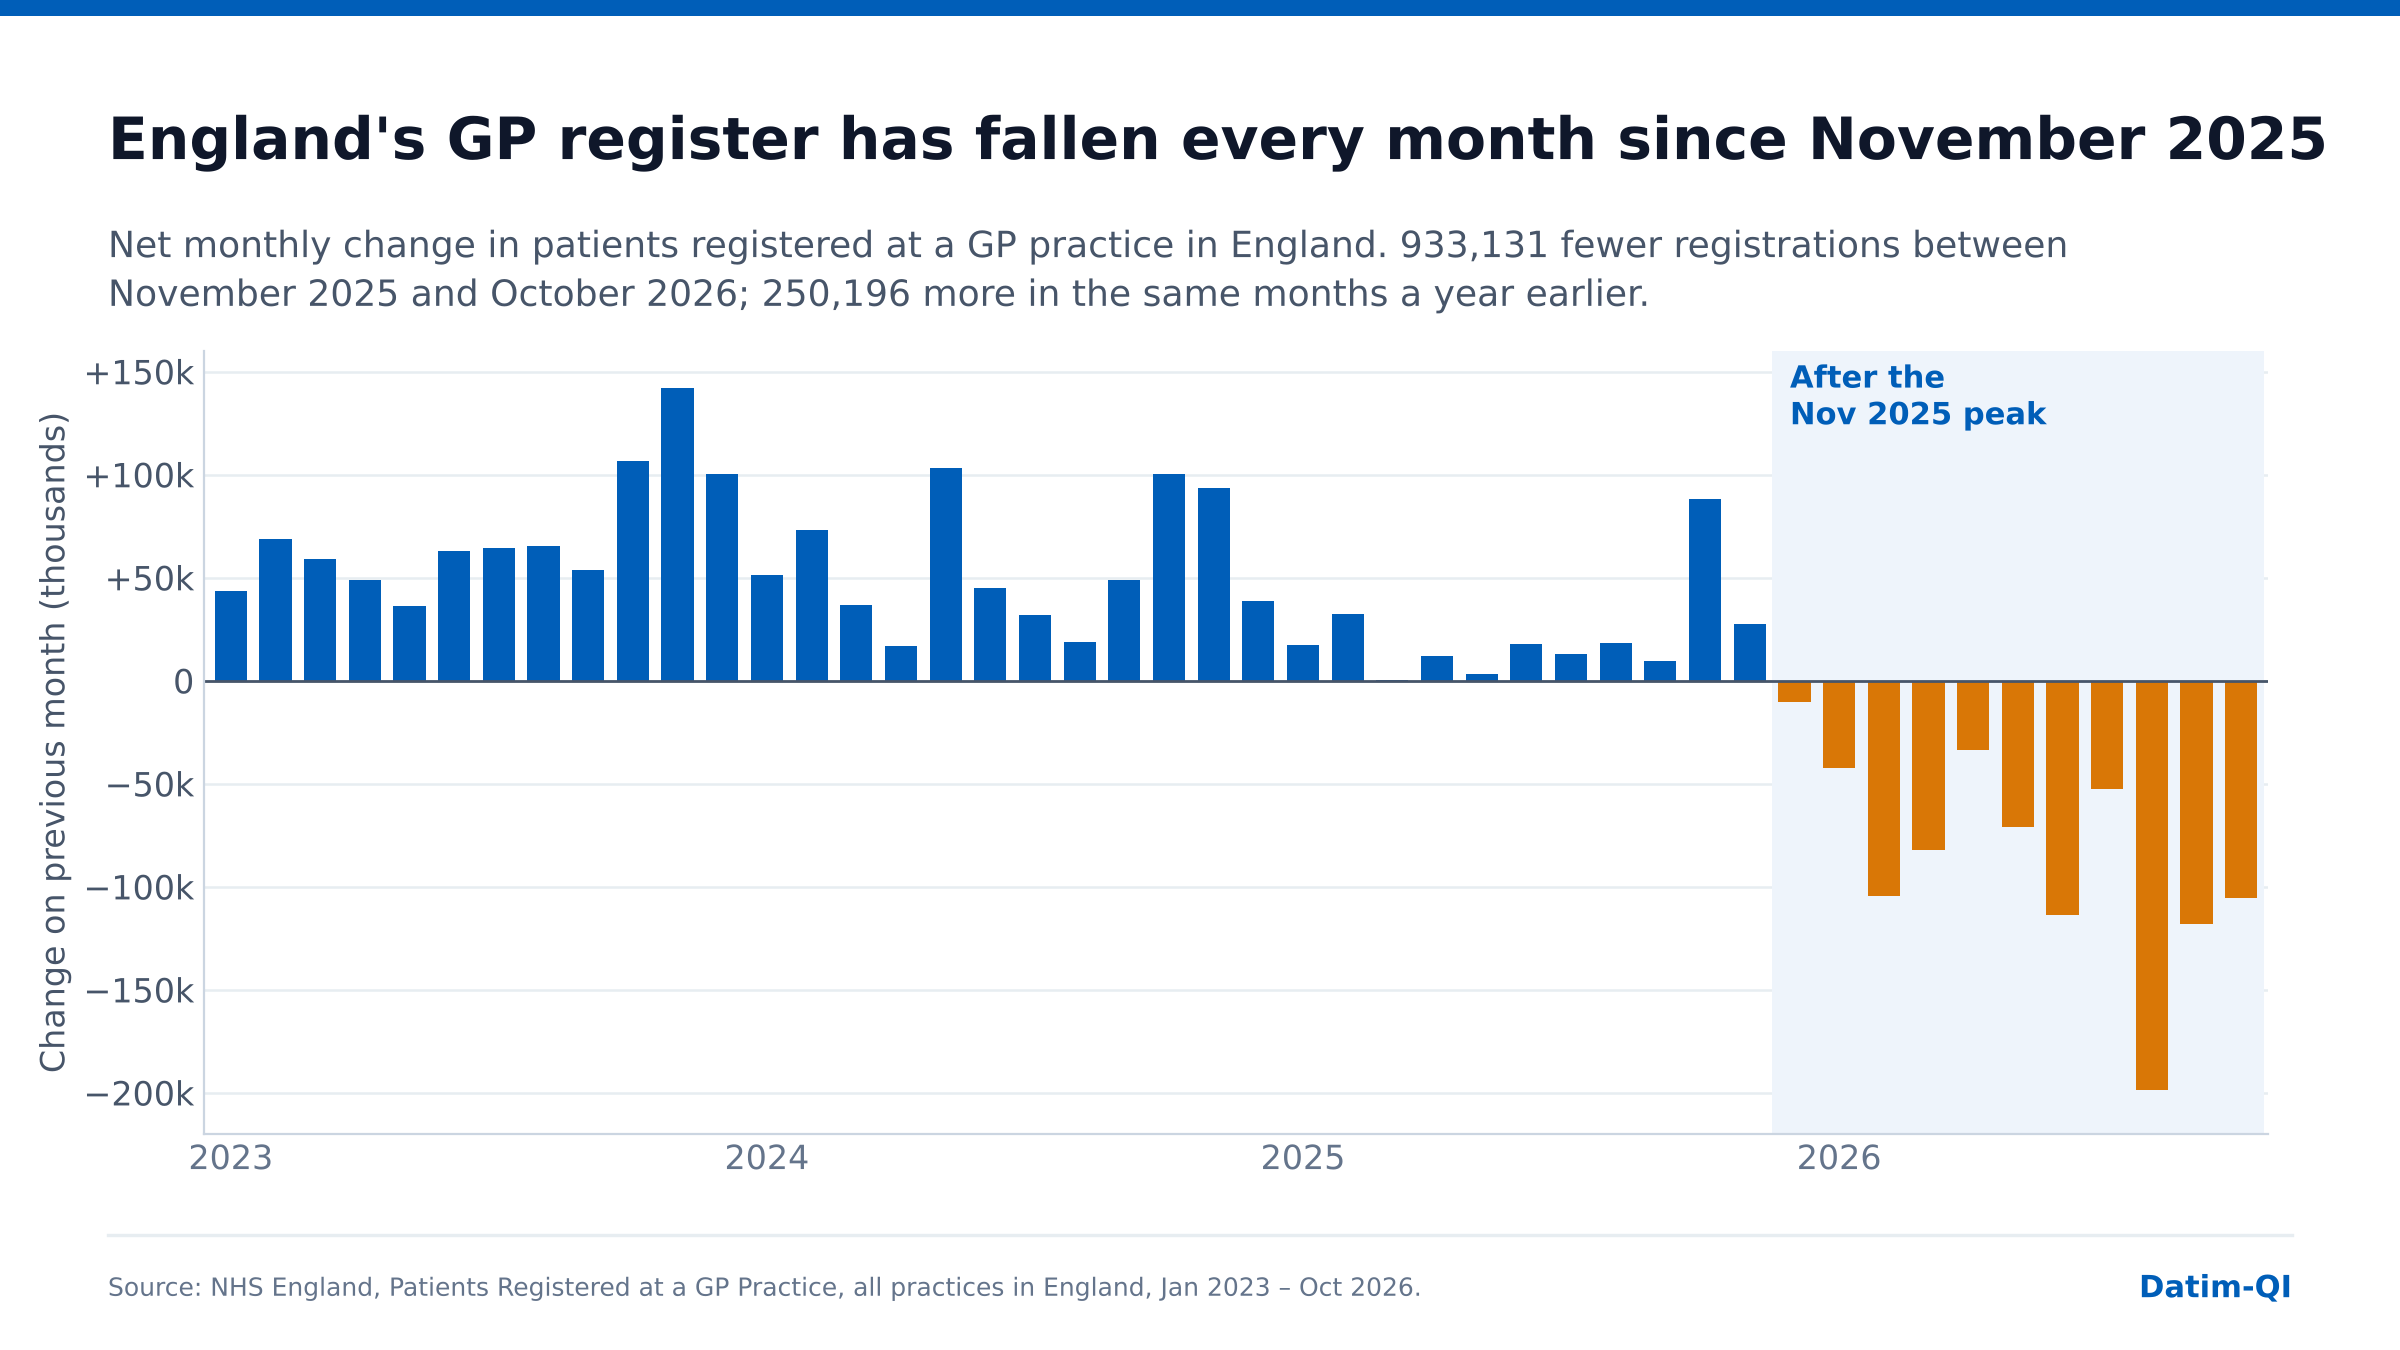
The number of people registered with a GP in England fell by 933,000 between November 2025 and October 2026, after years of growth. That coincides with NHS England’s list validation programme, run through Primary Care Support England, which contacts patients flagged as possibly inactive and removes those it cannot confirm. Press reports describe the time given to respond being cut from six months to three in autumn 2025. NHS England says the programme is not a new removal process, that patients are not removed for failing to answer a single letter, and that it takes more than five months from first identification to removal.
Practices are paid per registered patient, so every registration removed takes core funding with it. The BMA and LMCs have warned that people who move often, rent, share addresses or do not read English well are less likely to receive or answer a letter, and all of those are more common in deprived areas. So I wanted to know where the funding is being taken from.
The short answer
At the 2026/27 Global Sum, net of the out-of-hours deduction, October 2026 lists attract about £116 million a year less than November 2025 lists did. About £47 million of that has already been lost.
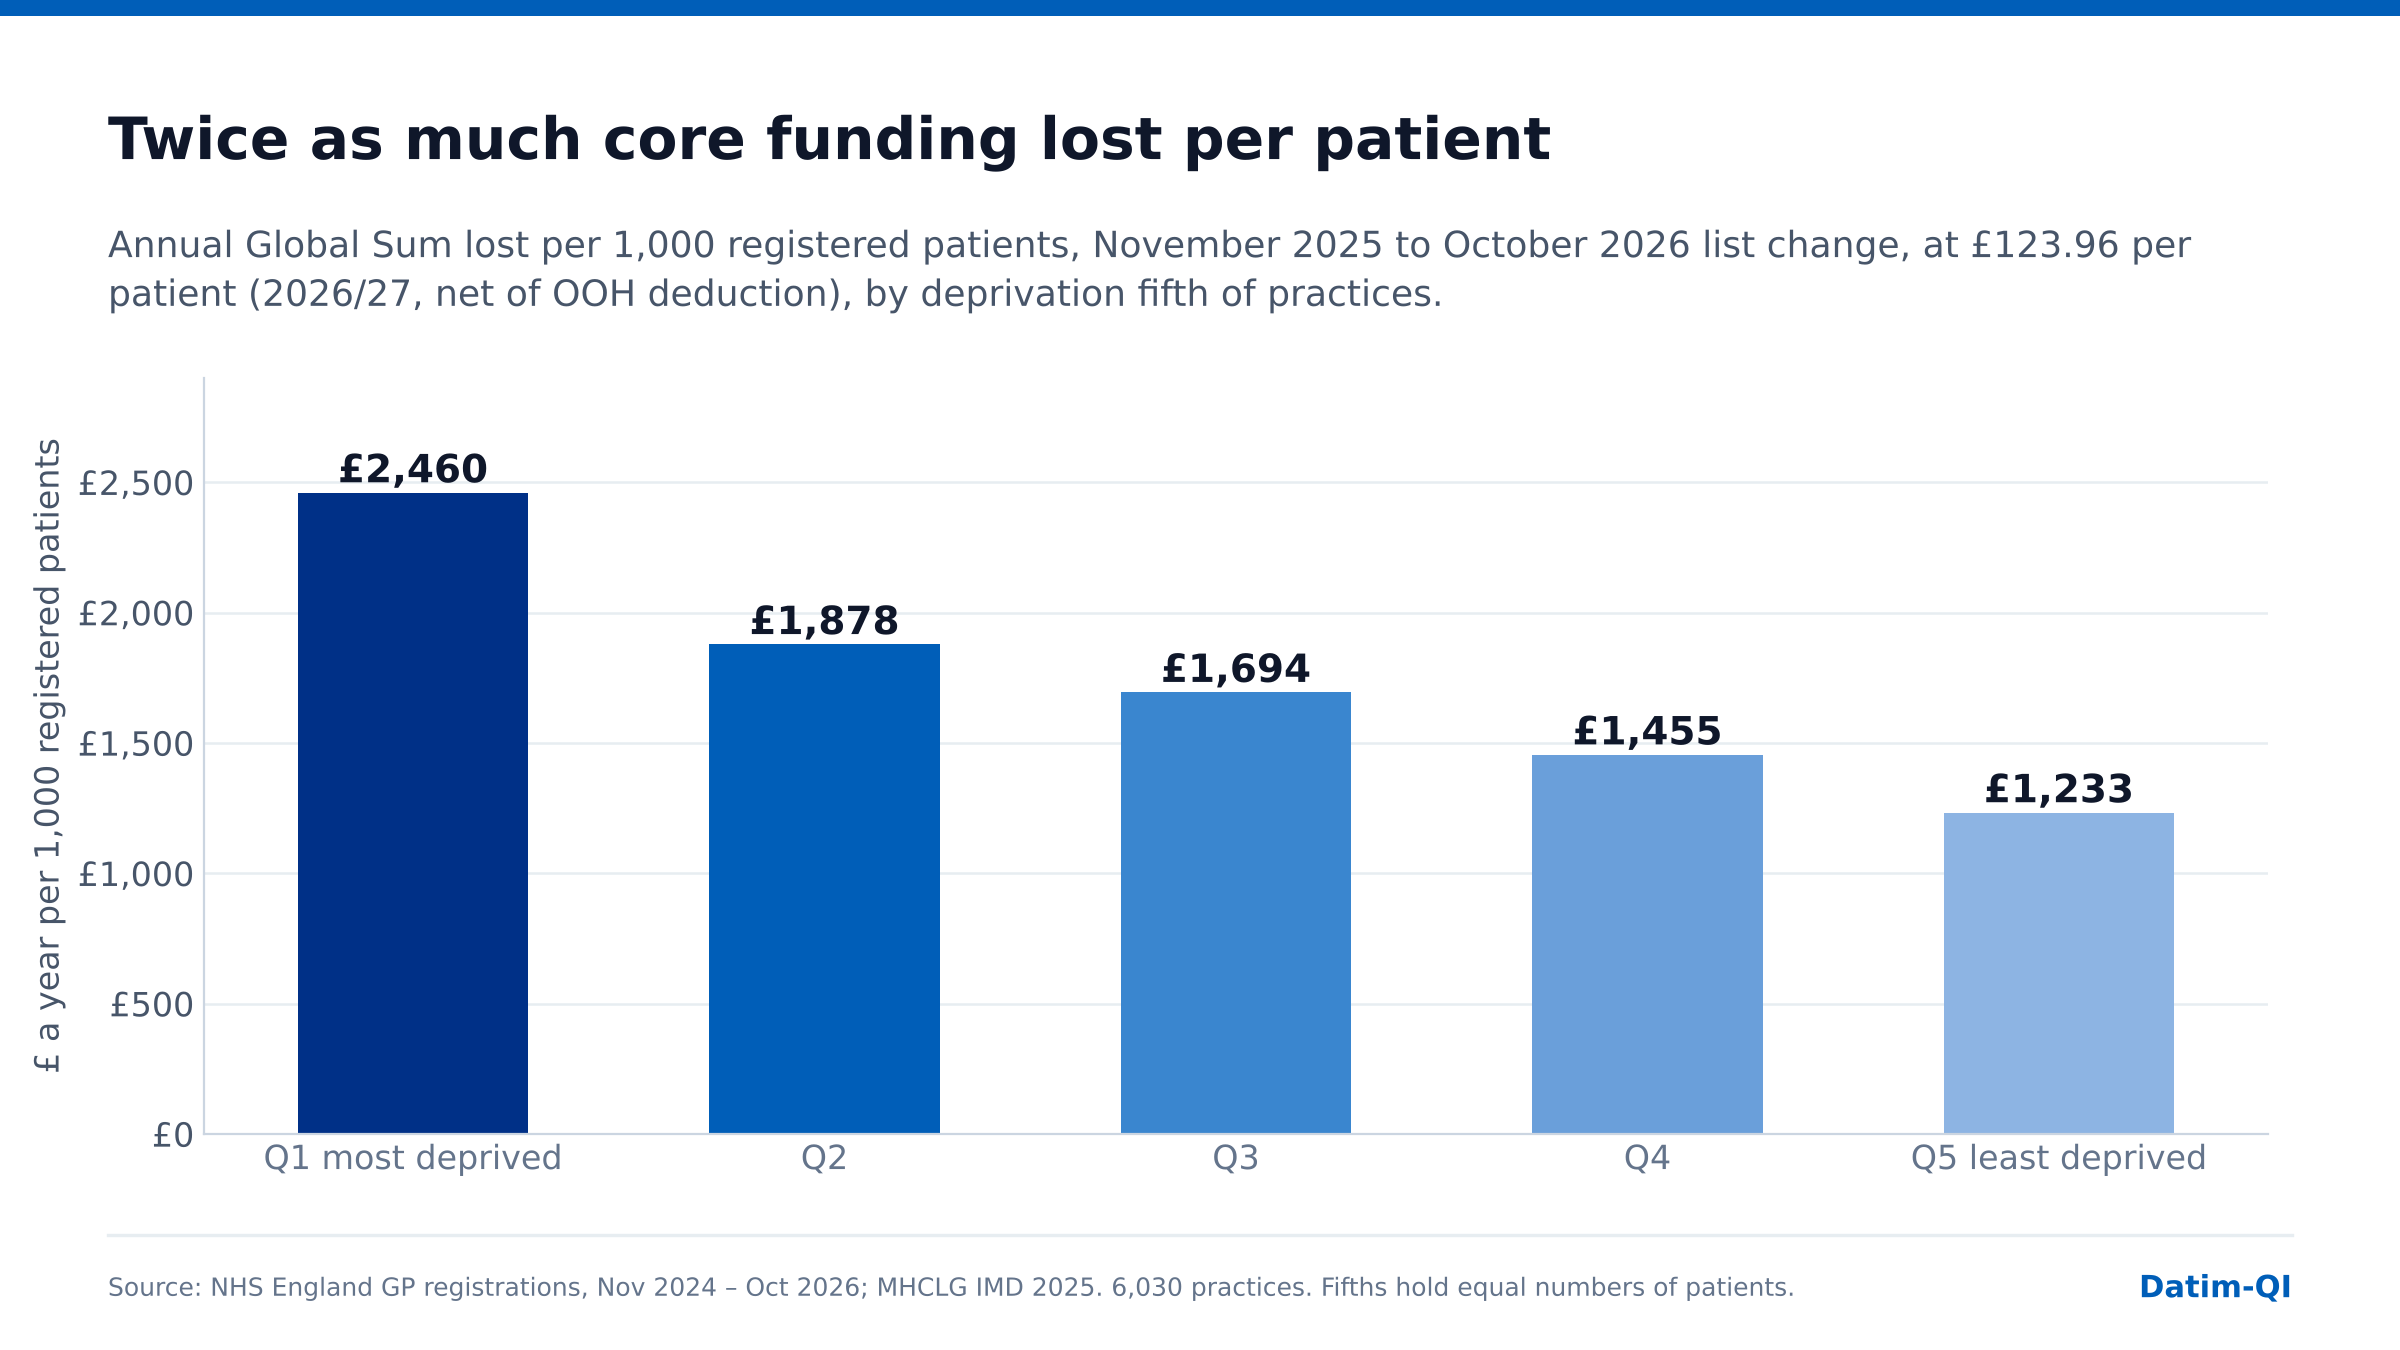
The money is not being taken evenly. Each fifth of practices, ranked by deprivation, holds 20% of registered patients, but the most deprived fifth loses 28% of the funding and the least deprived 14%. That is £2,460 a year per 1,000 registered patients in the most deprived fifth against £1,230 in the least deprived. The average practice in the most deprived fifth loses about £22,900 a year; in the least deprived, £14,100.
This is descriptive, not causal. The measure is the net change in registrations, which includes new registrations, deaths and moves as well as list validation, and it cannot distinguish a correctly removed registration from a real patient removed in error.
01
How the comparison was made
Each practice was given the Index of Multiple Deprivation 2025 score of the neighbourhood (LSOA) containing its main surgery. Practices were then ranked from most to least deprived and divided into fifths that each hold 20% of registered patients at the November 2025 peak. If the funding were being taken evenly, each fifth would lose 20% of it.
The Global Sum is £130.07 per weighted patient in 2026/27, as set out in NHS England’s 2026/27 contract guidance. Almost all practices have opted out of out-of-hours care and have £6.11 deducted, so the rate used here is £123.96. Practices are paid on their list, so the funding lost is the change in each practice’s list multiplied by that rate.
Practices in deprived areas are smaller on average, 9,300 registrations against 11,400 in the least deprived fifth, so the most deprived fifth contains more practices (1,334) than the least deprived (1,089). The analysis uses the 6,030 practices open in every month from November 2024 to October 2026, after excluding 93 whose list rose or fell by more than 15% in a single month, the usual sign of a merger or split.
02
Where the funding is being taken from
Nationally, the 63,947,100 registrations at the November 2025 peak attract £7,927 million a year at £123.96, and the 63,013,969 in October 2026 attract £7,811 million. The difference is about £116 million a year: what will be paid out less each year if lists stay at October 2026 levels. Because the fall built up month by month, the income actually lost from December 2025 to October 2026 is smaller, about £47 million.
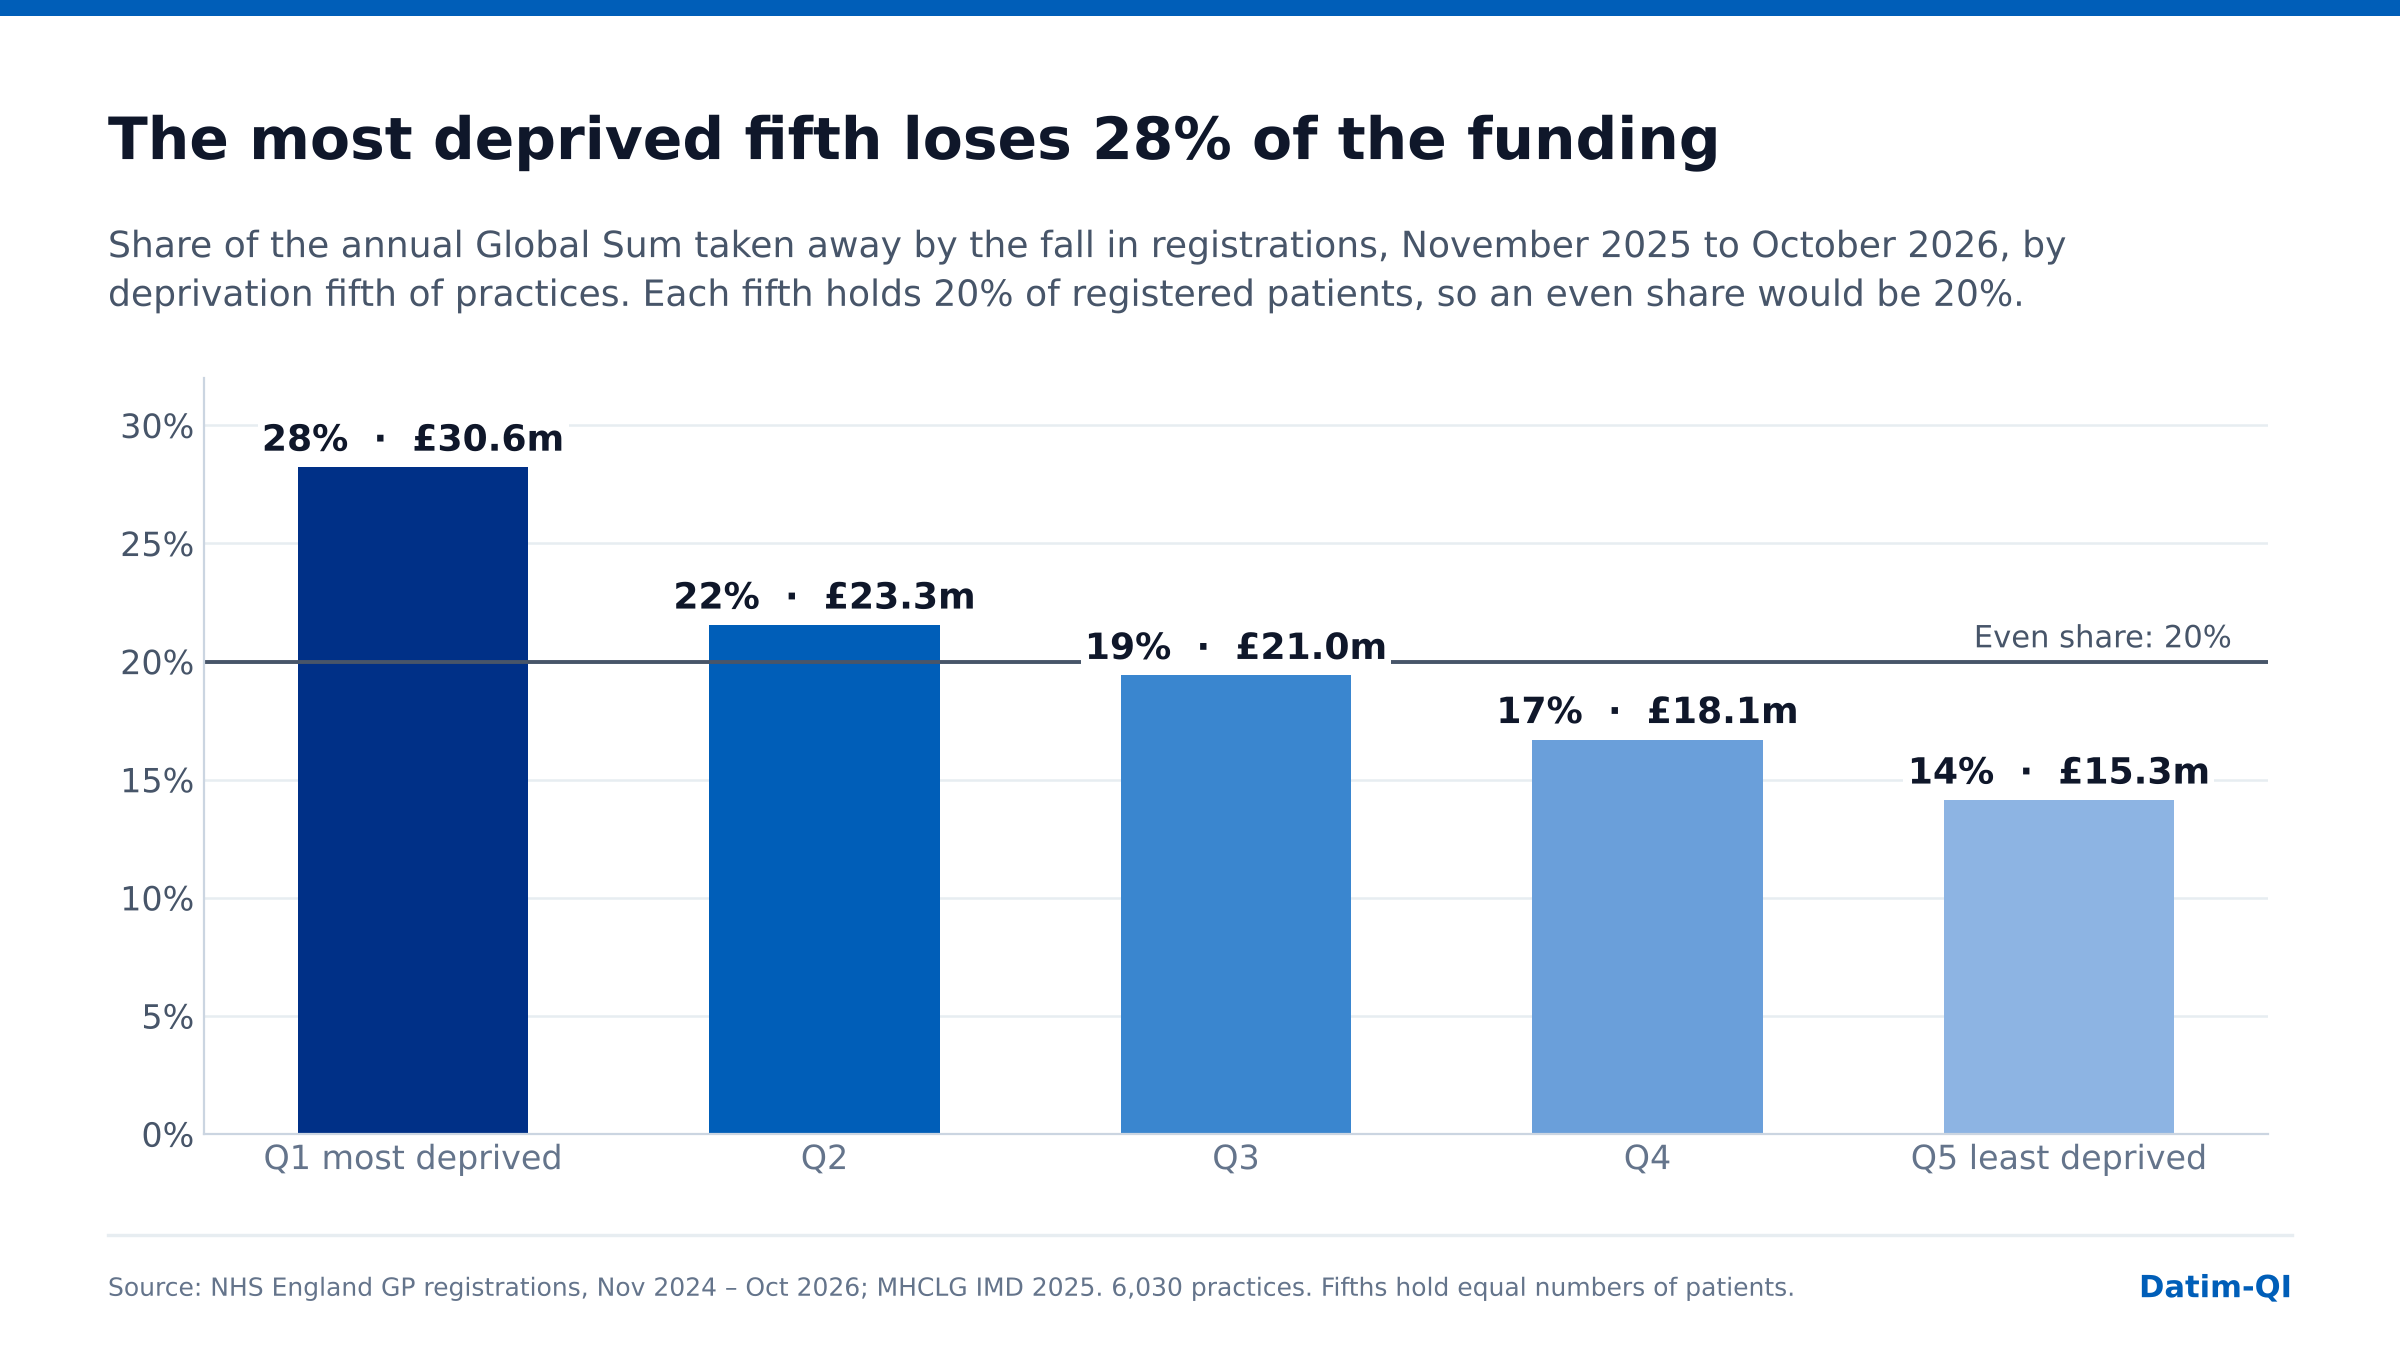
Among the practices analysed, the most deprived fifth loses £30.6 million a year, 28% of the total. The least deprived fifth loses £15.3 million, 14%. Each fifth in between sits in order. With the same number of patients in each fifth, the most deprived is losing twice as much core funding as the least deprived.
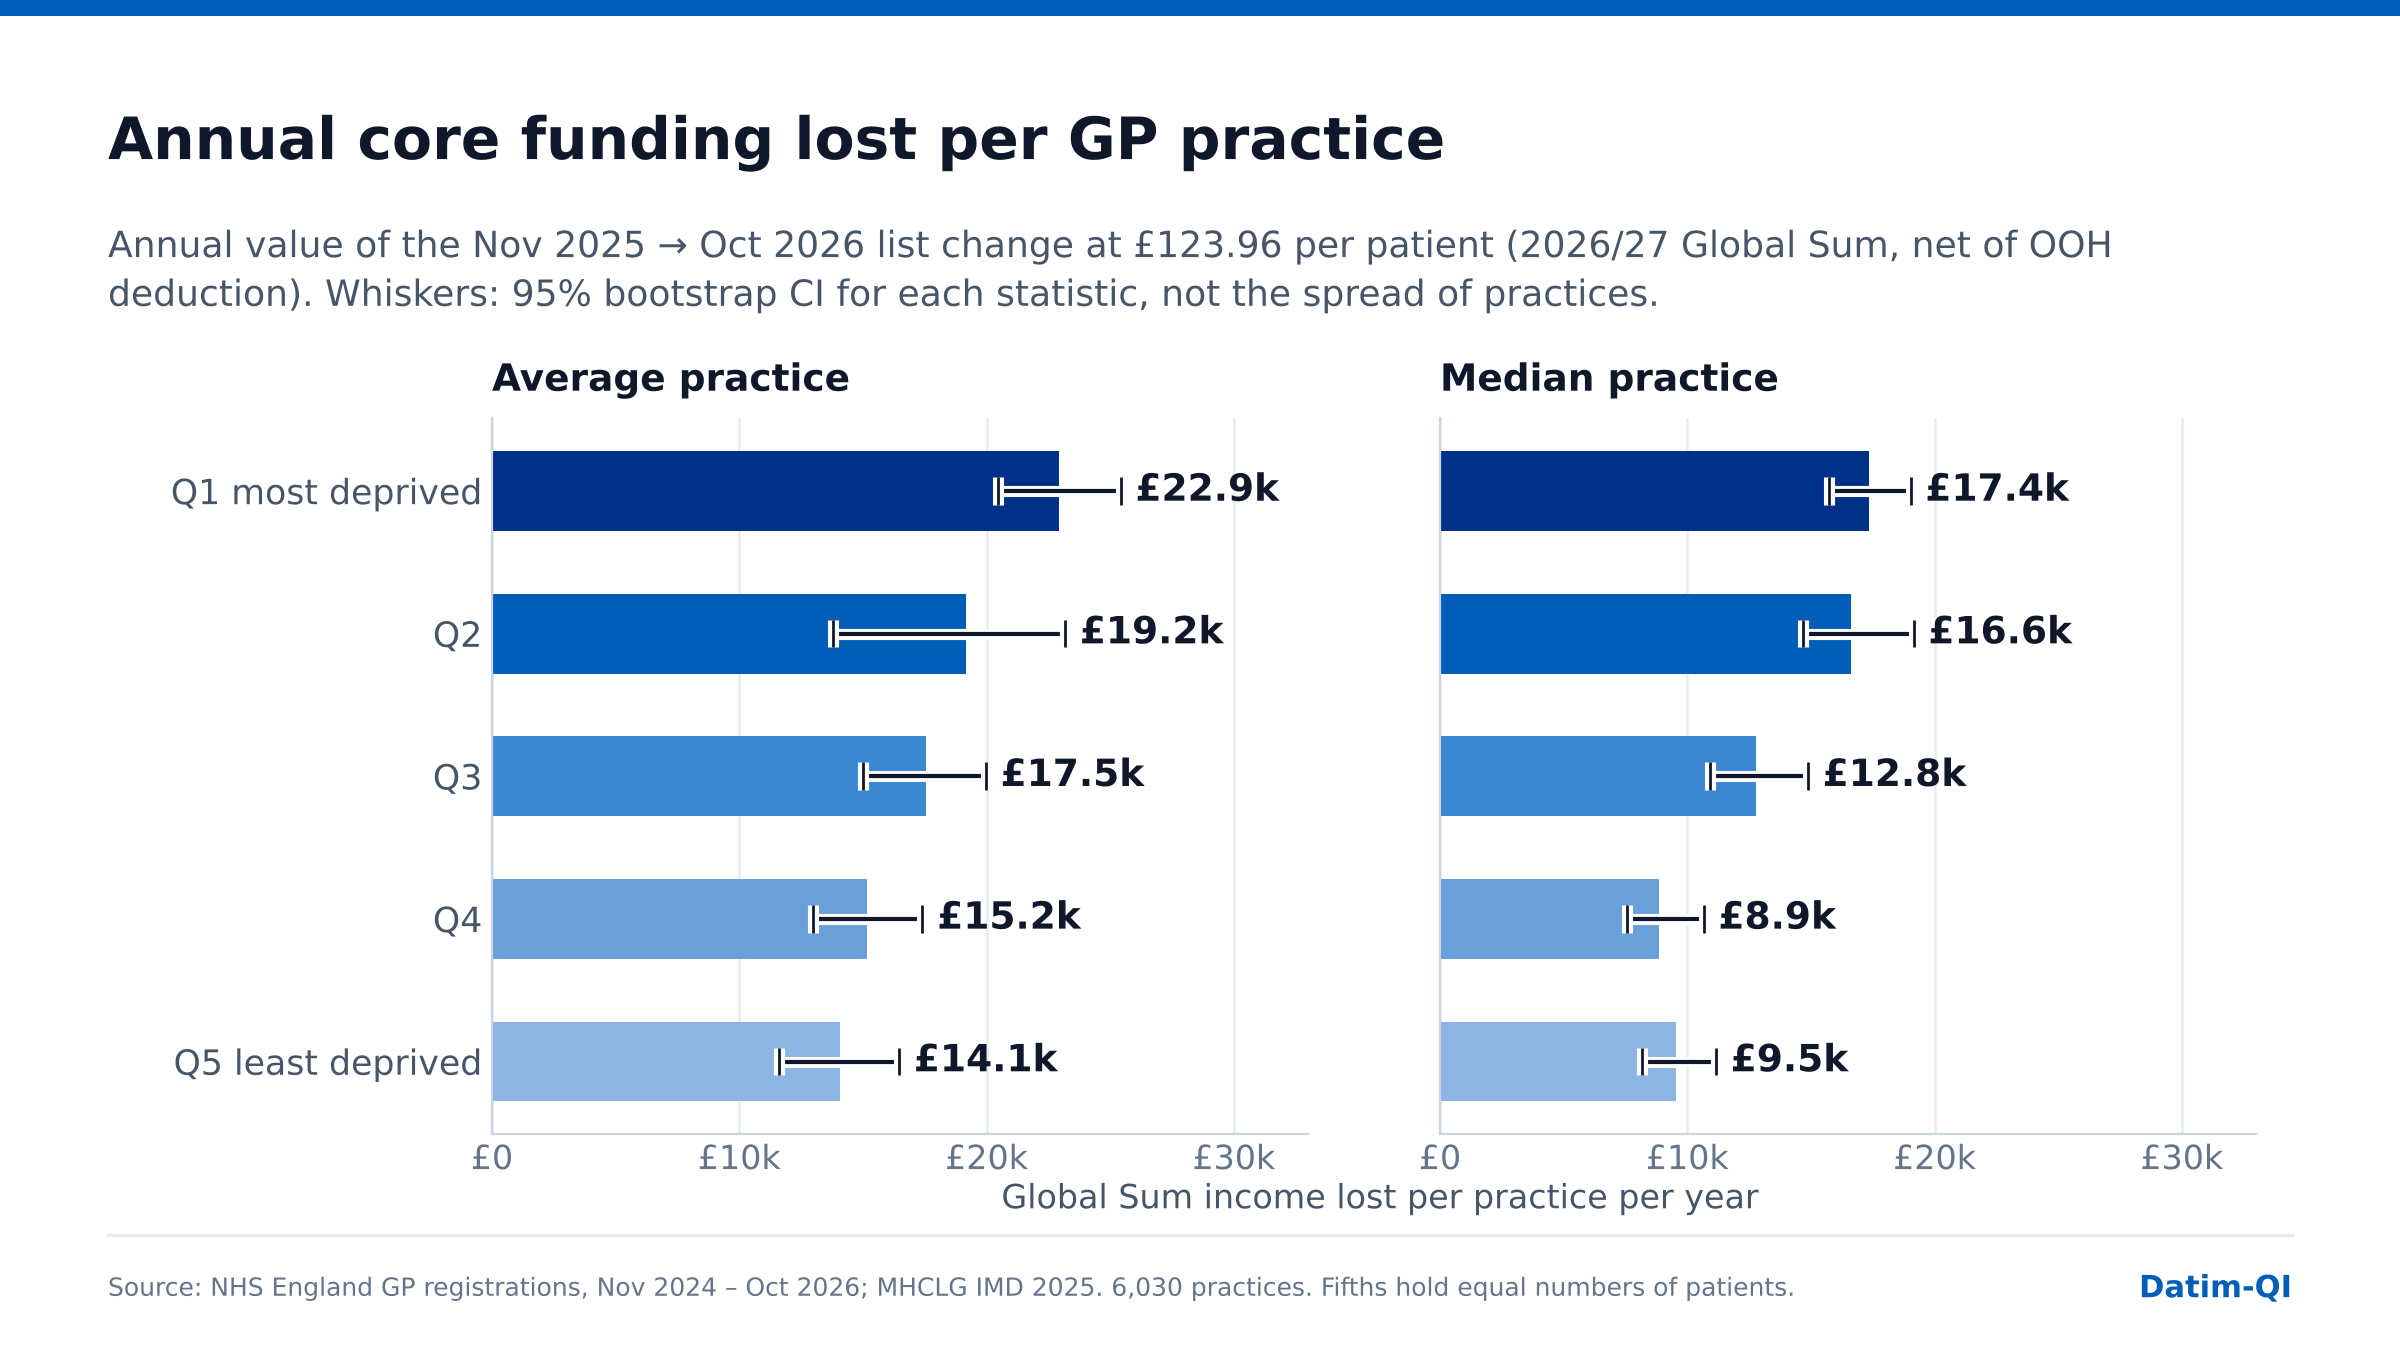
For the average practice in the most deprived fifth, October 2026 lists attract about £22,900 a year less than November 2025 lists (95% CI £20,400 to £25,400). In the least deprived fifth the figure is £14,100 (£11,600 to £16,500), a difference of about £8,900 a year per practice (£5,400 to £12,500). Deprived-area practices are also smaller, so the loss is a bigger share of their income: £2,460 a year per 1,000 registered patients against £1,230.
Losses are skewed: a minority of practices lost a great many registrations, which pulls the average above the typical practice. The median practice in the most deprived fifth loses £17,400 a year (95% CI £15,700 to £19,000), against £9,500 (£8,200 to £11,200) in the least deprived. The two sets of intervals measure different things: each says how precisely that statistic is estimated, not how widely practices vary.
| Deprivation fifth | A year from now: average | A year from now: median | Lost so far: average | Lost so far: median |
|---|---|---|---|---|
| Most deprived | £22,916 | £17,354 | £9,006 | £6,508 |
| Second | £19,187 | £16,611 | £7,311 | £6,167 |
| Middle | £17,532 | £12,768 | £7,295 | £4,442 |
| Fourth | £15,170 | £8,863 | £5,897 | £3,223 |
| Least deprived | £14,057 | £9,545 | £5,527 | £2,954 |
| All practices | £17,963 | £13,016 | £7,081 | £4,659 |
So far, the average practice in the most deprived fifth has lost about £9,000 and the average practice in the least deprived fifth about £5,500.
Against the previous year’s trend
Practices were growing before the change, so the net loss understates the difference from what would otherwise have happened. Had each practice repeated its growth from the previous year, the average practice in the most deprived fifth would be about £26,300 a year better off than it is, against £21,500 in the least deprived. The gap is narrower on this measure because the least deprived practices had been growing faster, but it is in the same direction.
03
Behind the money: registrations lost
The funding follows the registrations. The average practice in the most deprived fifth lost 185 registrations (95% CI 165 to 205); in the least deprived fifth, 113 (94 to 133). As a share of the list that is 2.0% against 1.0%. Of practices in the most deprived fifth, 78% shrank, against 68% in the least deprived.
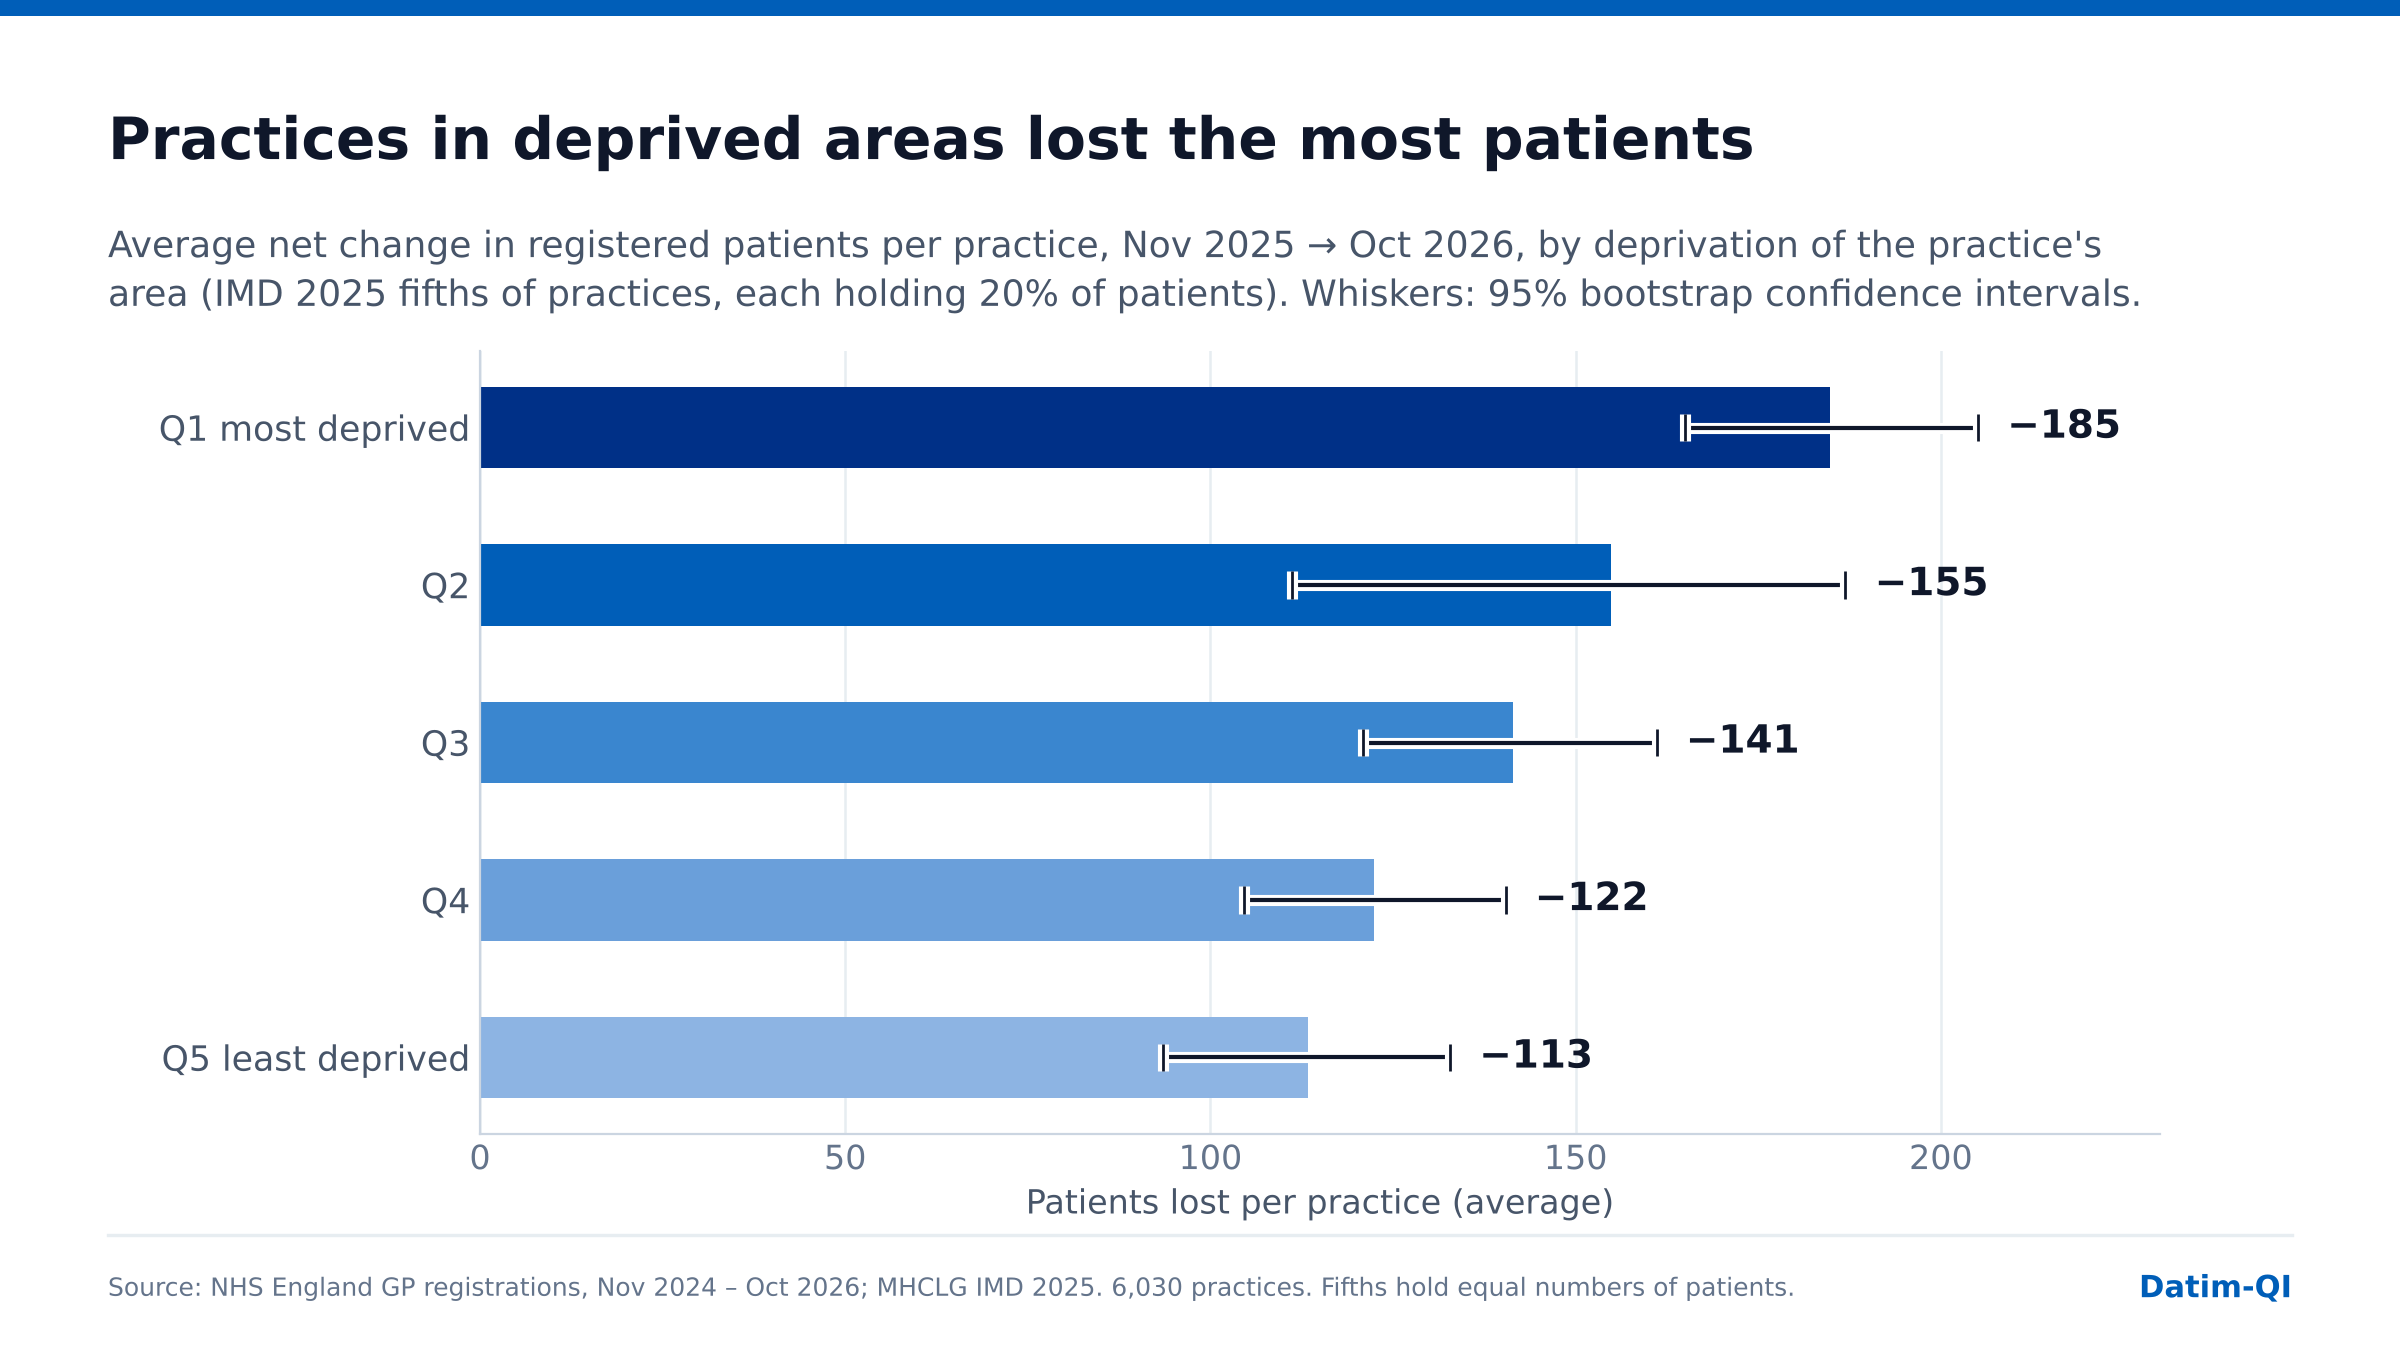
| Deprivation fifth | Practices | Average lost | Change in list | Year earlier | Against trend |
|---|---|---|---|---|---|
| Most deprived | 1,334 | 185 | −2.0% | +0.3% | −2.3% |
| Second | 1,216 | 155 | −1.5% | +0.4% | −1.9% |
| Middle | 1,199 | 141 | −1.4% | +0.5% | −1.8% |
| Fourth | 1,192 | 122 | −1.2% | +0.4% | −1.6% |
| Least deprived | 1,089 | 113 | −1.0% | +0.5% | −1.5% |
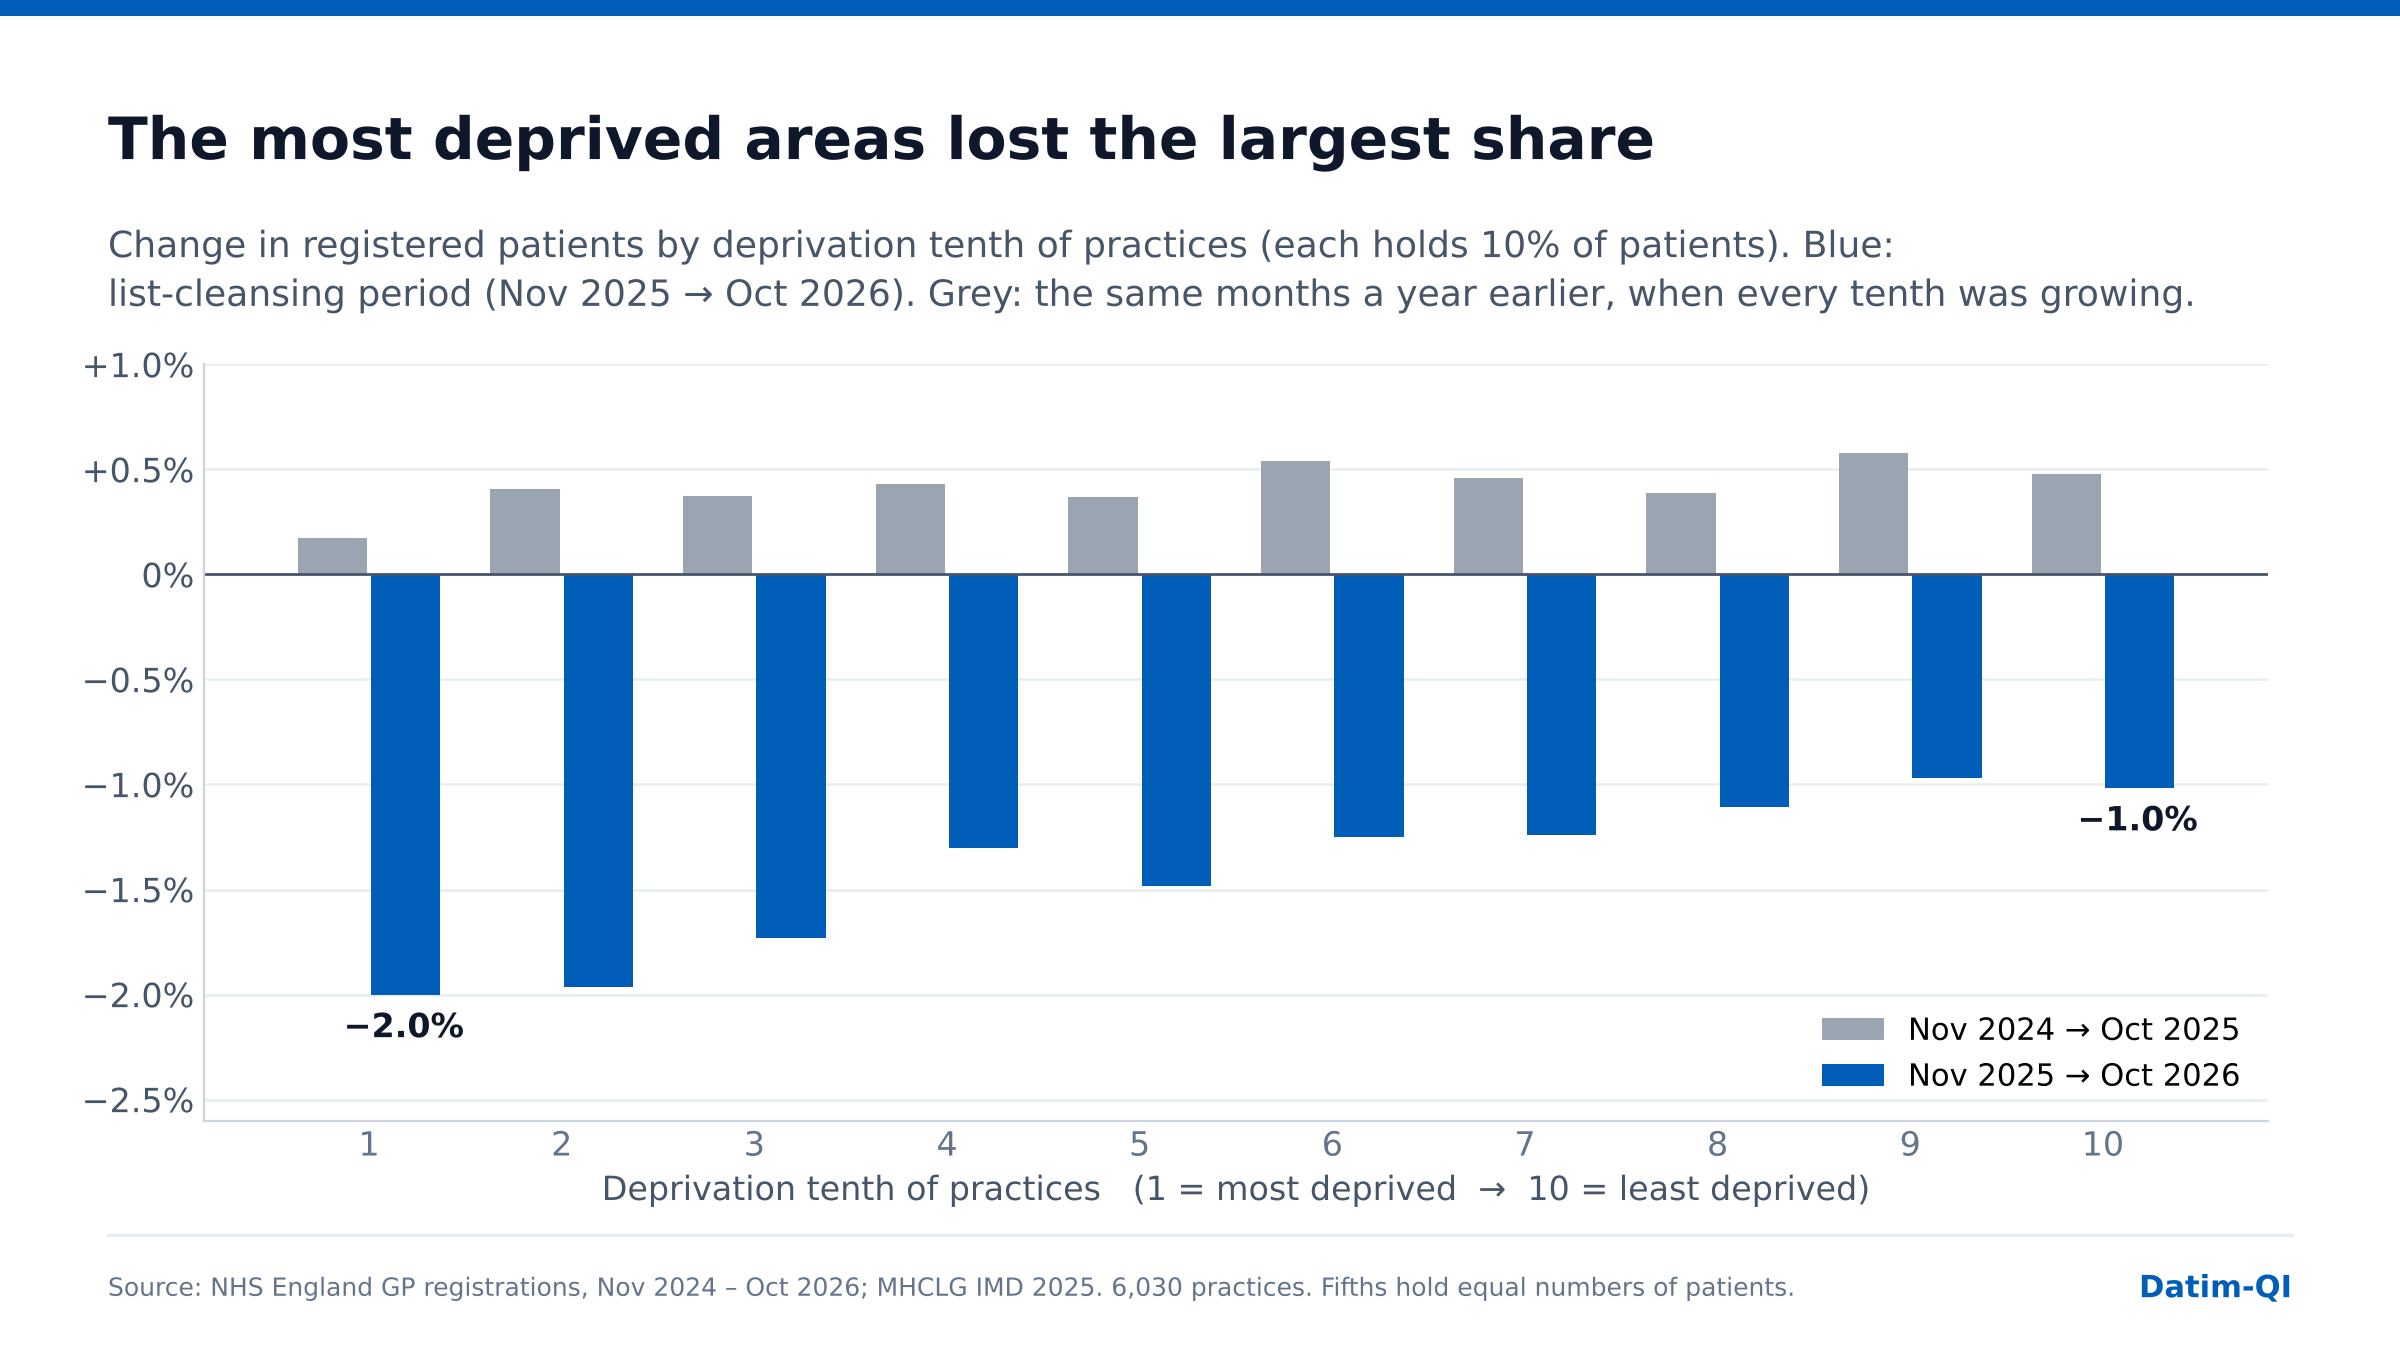
In the year before, every fifth was growing, and the least deprived faster than the most deprived. Measured against that trend, the most deprived fifth fell by 2.3 points and the least deprived by 1.5, a gap of about one and a half times rather than two, in the same direction.
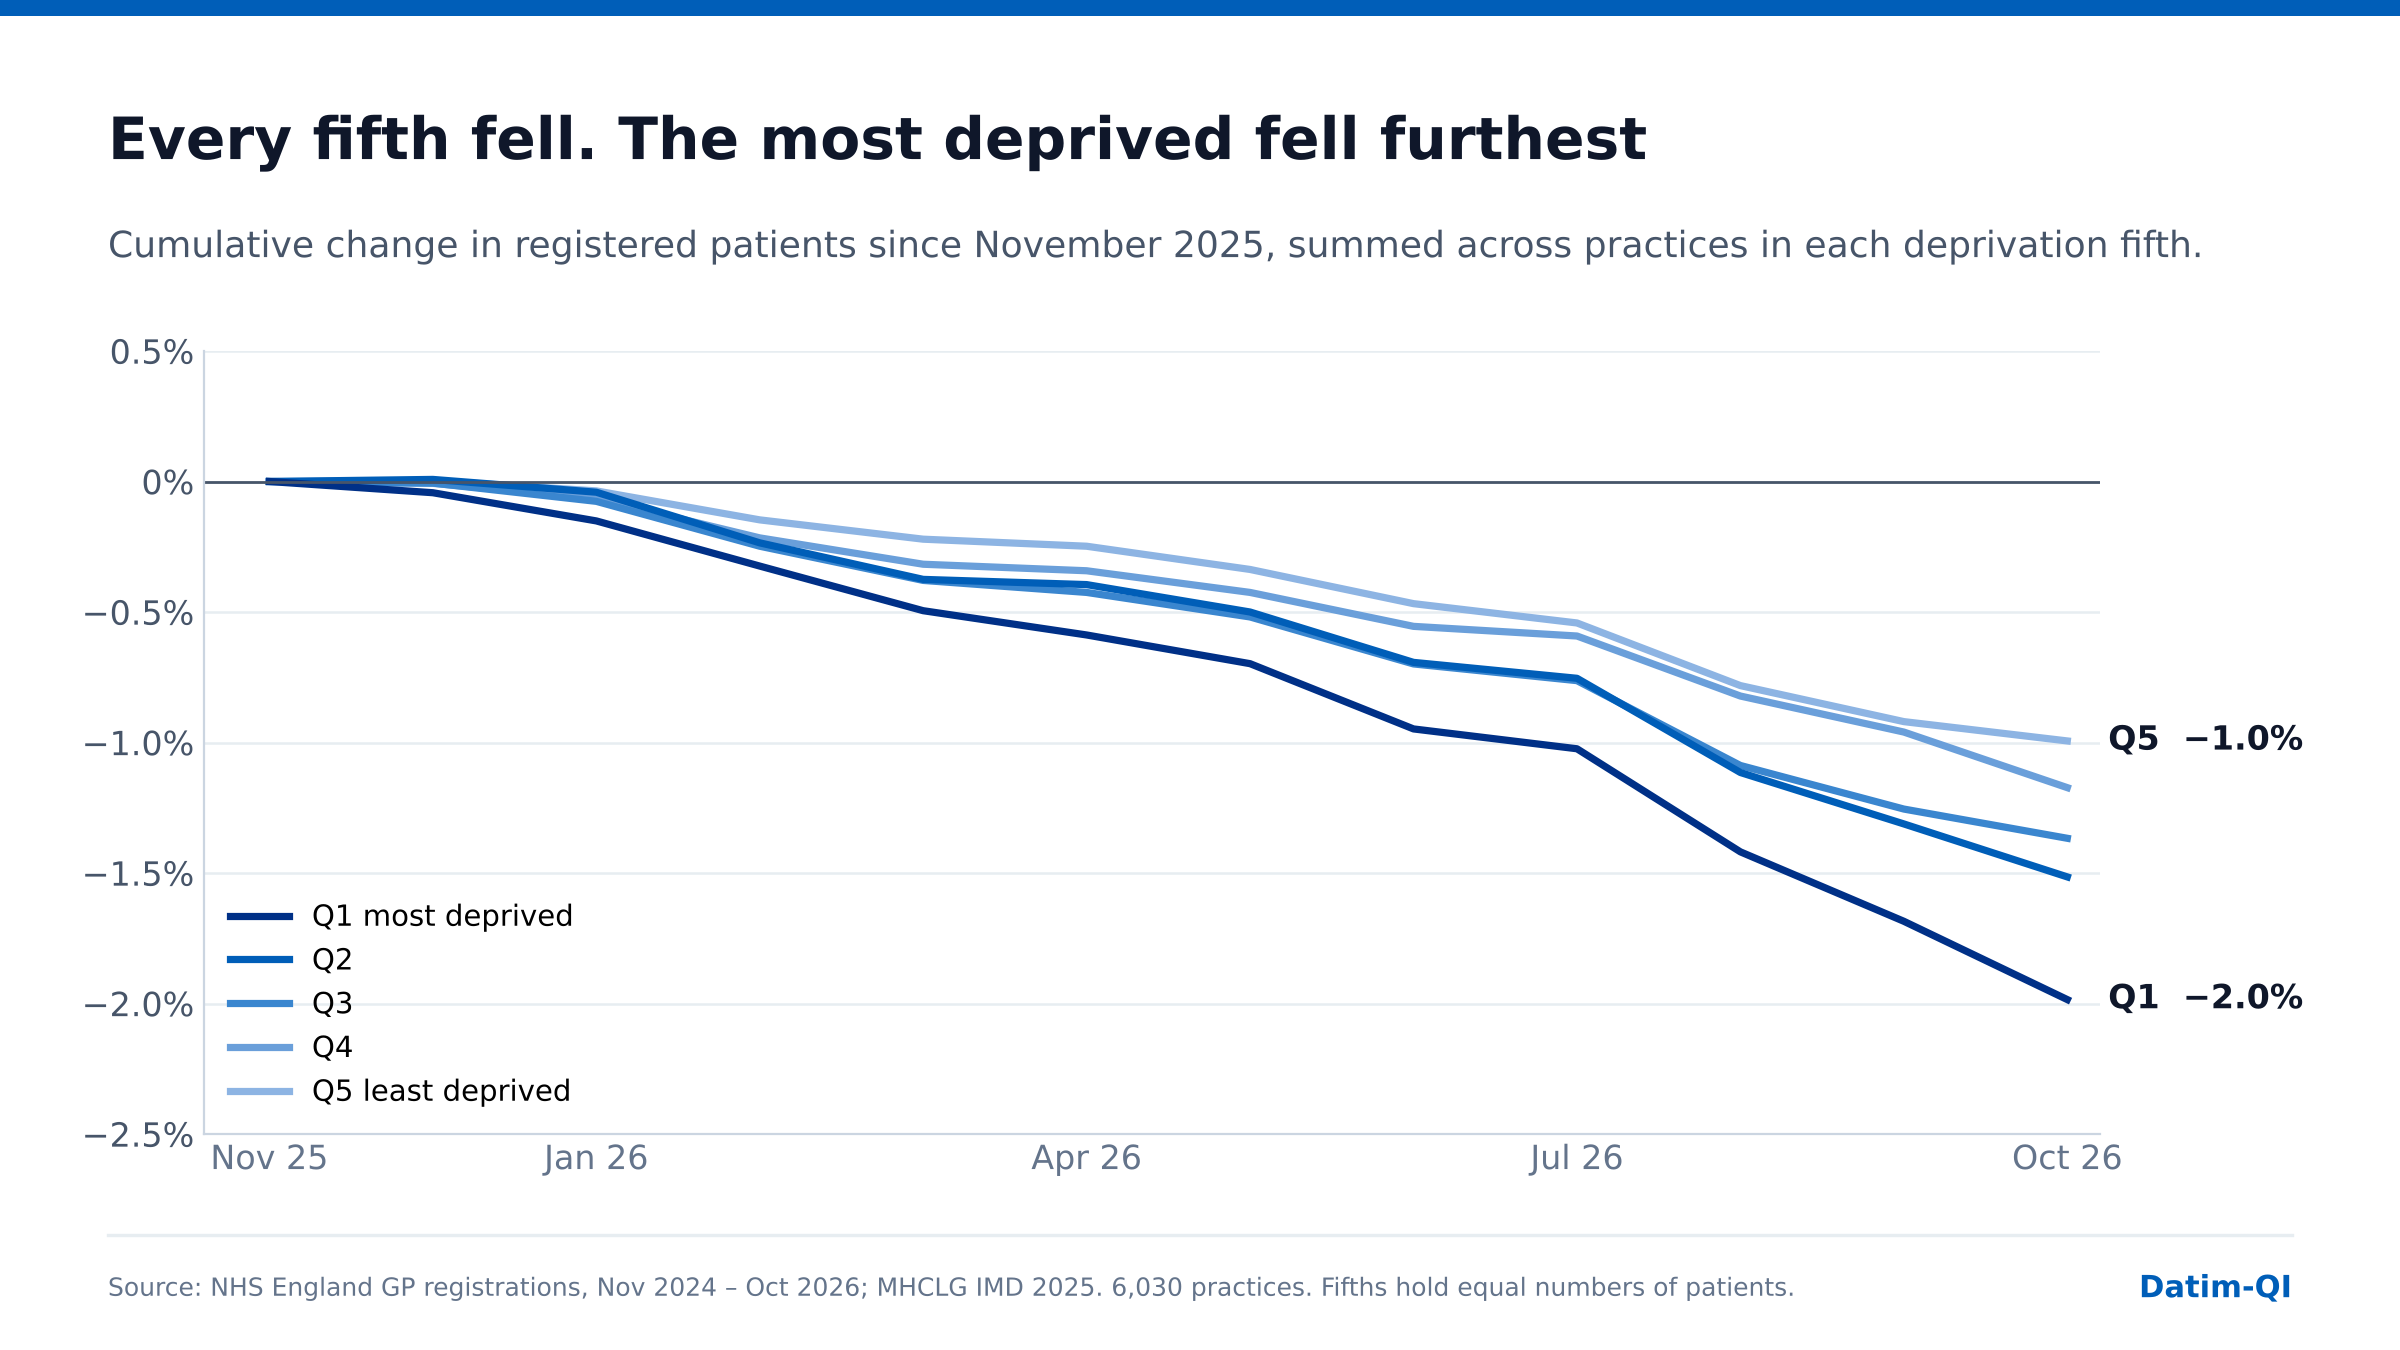
The gap opened steadily, month by month, and there is no sign in the latest months that it is narrowing. Split into tenths, the two most deprived both lost 2.0% and the two least deprived about 1.0%.
04
What the figure includes and leaves out
QOF. It is tempting to assume lost registrations also take QOF income with them, but mostly they do not. Payments for disease-register indicators are adjusted for list size and for prevalence, and because prevalence is the register divided by the list, the two adjustments largely cancel: payment follows the number of people on the register. A registration belonging to someone who has left the country is on no register, so removing it changes little. For population indicators such as cervical screening, removing inactive registrations from the denominator raises recorded achievement. QOF income falls only where real patients on disease registers are removed, and that cannot be estimated from list sizes, so QOF is left out.
Other payments. Some PCN payments are also calculated per weighted patient and fall with list size; they are not included, so the total taken from practices and their networks is larger than the Global Sum alone.
Weighting. The Global Sum is paid per Carr-Hill weighted patient. Weighted and raw lists match nationally, so each lost registration is valued here at the national average. Where the people removed carry below-average weights, the loss will be smaller than shown; where they carry above-average weights, larger.
Contract type. The Global Sum applies to GMS contracts. PMS and APMS practices are funded under their own agreements, so the figures use the Global Sum as a proxy for all practices.
05
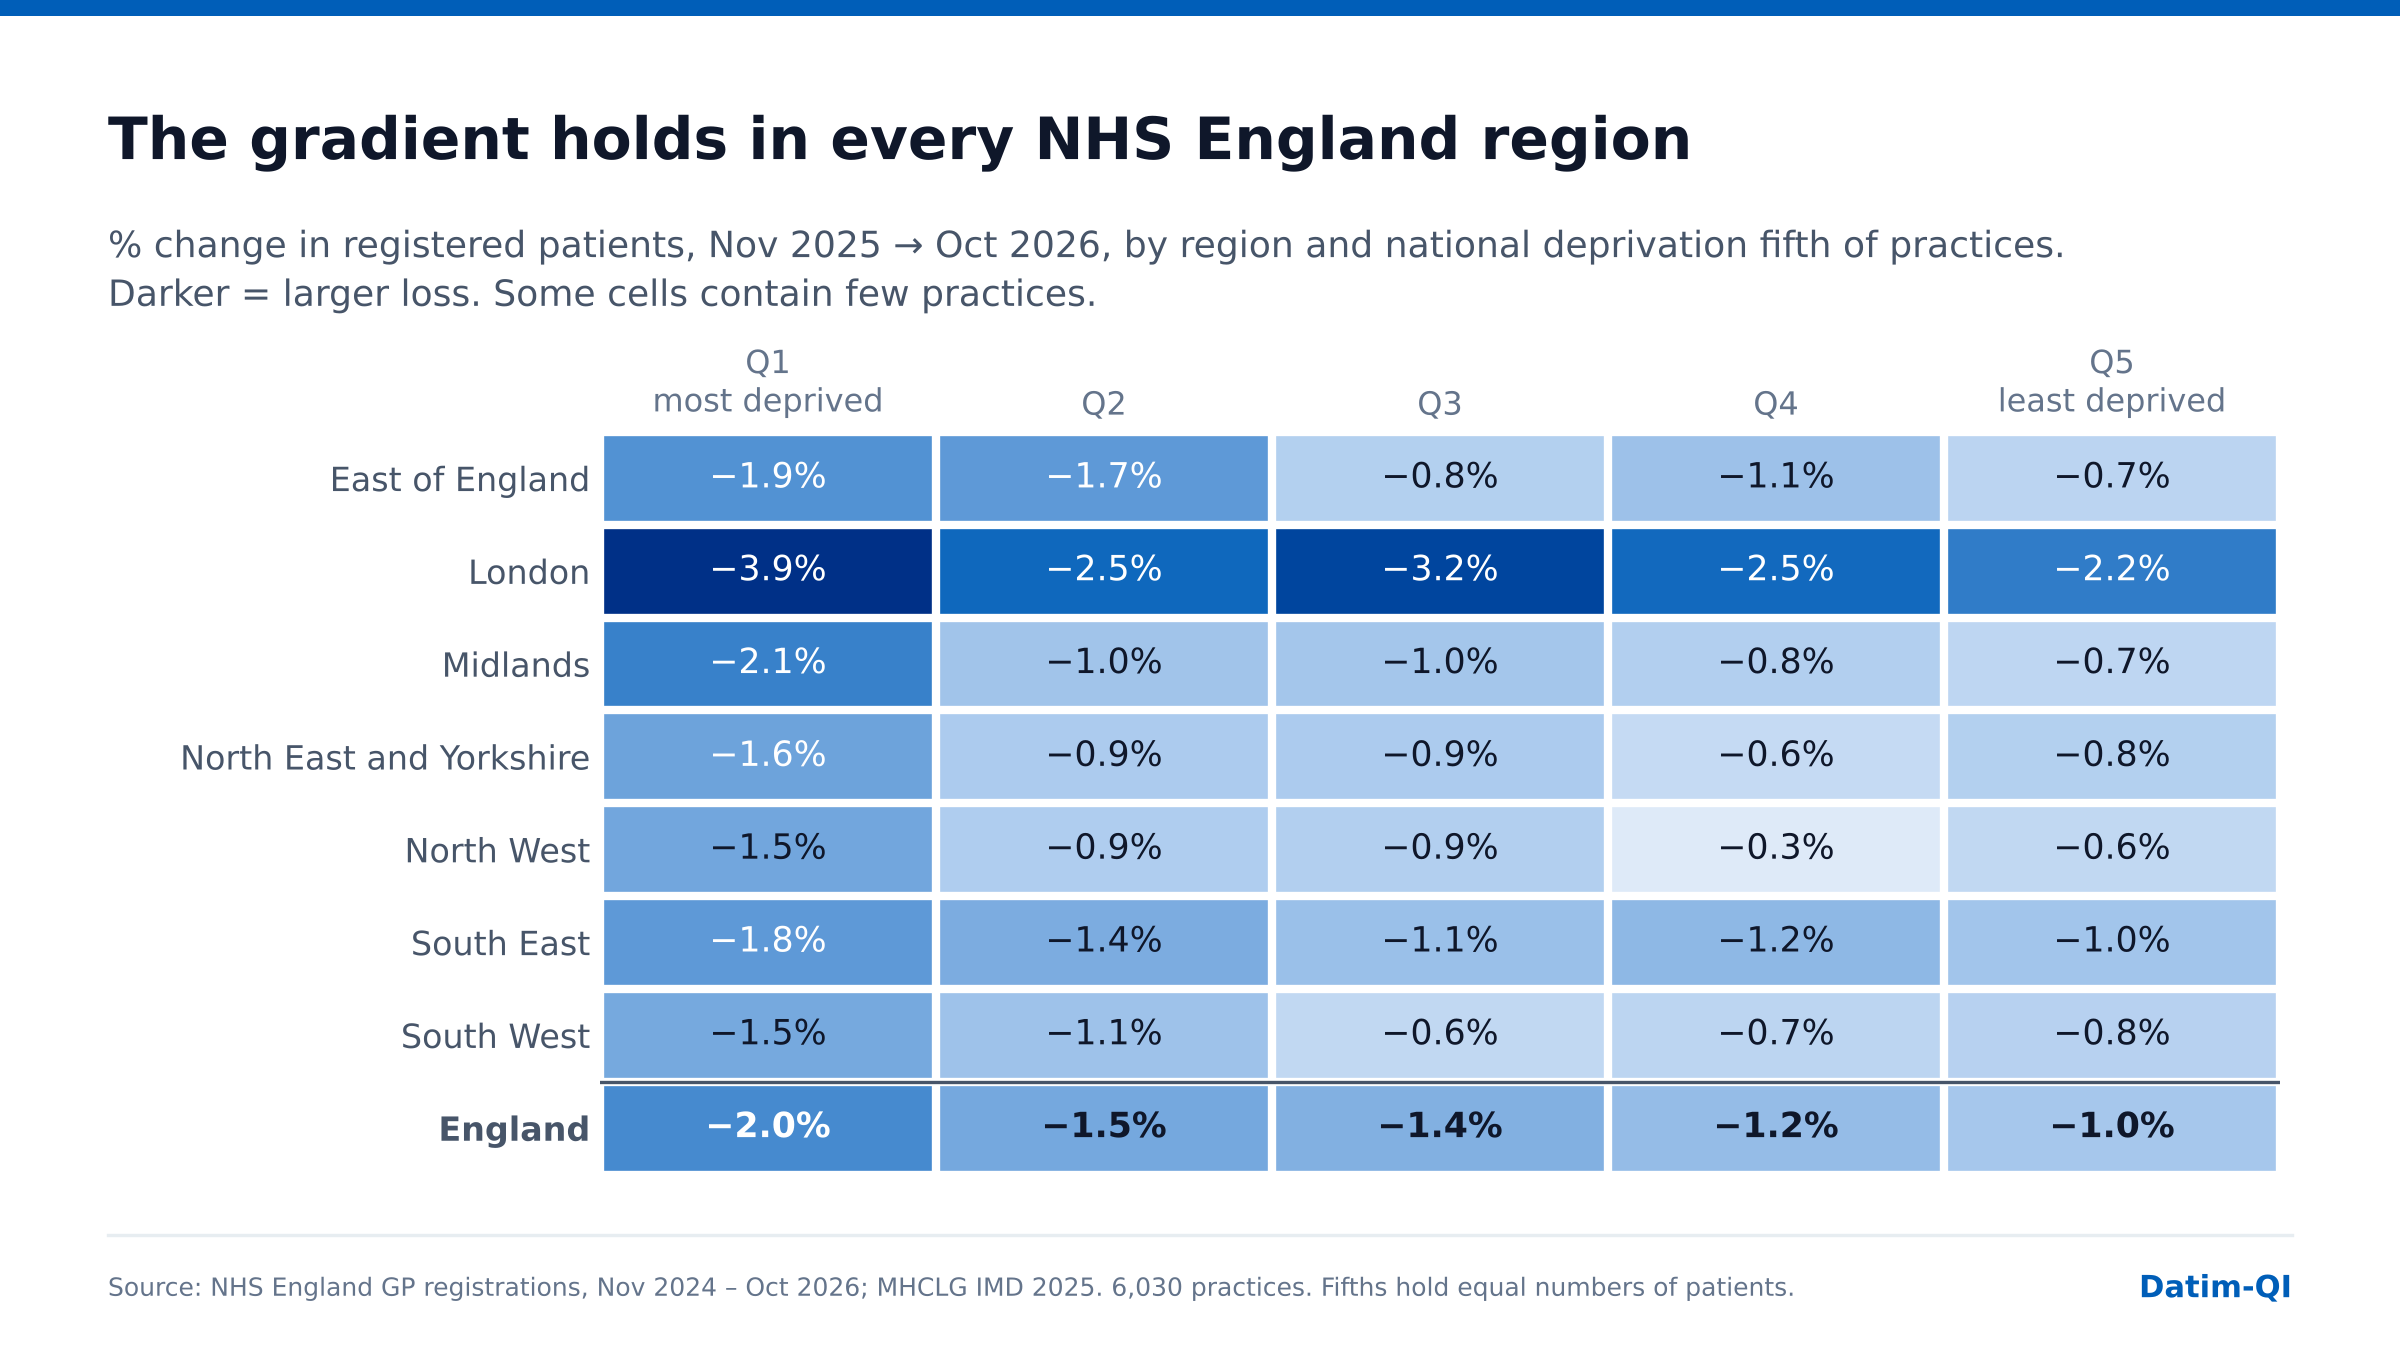
Not a London effect
London practices lost the most, between 2.2% and 3.9% of their registrations across the fifths. But in each of the seven NHS England regions the most deprived fifth lost a larger share than the least deprived. The confidence intervals separate clearly in four regions (East of England, London, the Midlands and the North West) and overlap in the other three.
The same holds when deprivation is treated as a continuous score. Comparing practices within the same ICB, allowing for practice size and each practice’s change in the previous year, every 10 additional IMD points was associated with a further 0.25 percentage point fall (95% CI 0.20 to 0.29). Comparing practices within the same local authority gives 0.20 points (0.15 to 0.25).
| Model | Per 10 IMD points | 95% CI |
|---|---|---|
| IMD score only | −0.22 pp | −0.28 to −0.16 |
| + NHS England region | −0.29 pp | −0.34 to −0.25 |
| + region, previous-year change, list size | −0.26 pp | −0.31 to −0.21 |
| + ICB, previous-year change, list size | −0.25 pp | −0.29 to −0.20 |
| + local authority, previous-year change, list size | −0.20 pp | −0.25 to −0.15 |
06
How robust the result is
The direction of the gap between the most and least deprived fifths does not depend on the choices made above. Its size does: from one and a half times, against the previous year’s trend, to nearly three times when measured from September 2025. Because funding is valued at a flat rate per registration, the funding gap moves with it.
| Check | Most deprived | Least deprived | Ratio |
|---|---|---|---|
| Main analysis, November 2025 to October 2026 | −2.0% | −1.0% | 2.0 |
| Starting from September 2025, before autumn registrations | −1.9% | −0.7% | 2.7 |
| Starting from December 2025 | −1.9% | −1.0% | 1.9 |
| Excluding 95 practices with student-type autumn surges | −2.0% | −0.9% | 2.2 |
| Excluding London | −1.7% | −0.8% | 2.1 |
| Fifths with equal numbers of practices | −1.9% | −1.0% | 1.9 |
| National neighbourhood (LSOA) quintiles | −1.9% | −1.0% | 1.9 |
| Against each fifth’s previous-year change | −2.3% | −1.5% | 1.5 |
The losses are concentrated. The 5% of practices that lost most account for 26% of all registrations lost, which is why the median practice is reported alongside the average throughout.
07
What the data cannot show
The published data show how many registrations each practice lost, not who was removed or why. Some will be people who have left the area or the country; some will be real patients who did not answer a letter in time. LMC polling reported in the press found that more than two-thirds of practices had reinstated patients removed inappropriately.
Where real patients are removed, the practice keeps the work and loses the funding
A patient removed in error does not stop needing care. They return, re-register or are seen as temporary residents, and the practice carries the workload while the funding has gone. Removal and reinstatement figures by practice, which have not been published, would show how much of the £116 million falls on practices still caring for the patients concerned.
08
The bottom line
List cleansing is taking about £116 million a year out of general practice’s core funding, and it is not taking it evenly. Per registered patient, practices in the most deprived fifth of areas are losing twice as much as those in the least deprived: £2,460 a year per 1,000 patients against £1,230, or about £22,900 a year for the average practice against £14,100.
Those are the practices with the greatest health needs on their lists. If any meaningful share of the removals are real patients, the funding is leaving practices in deprived areas while the work stays.
Three things are needed: practice-level counts of list-validation removals and reinstatements, published alongside the registration data; the same counts broken down by age, patient-level deprivation and protected characteristics; and an independent audit of the error rate, which LMCs have asked for.
09
Postscript: why the estimates differ
Other estimates of the money lost to list cleansing are now in circulation, and they do not match this one. Pulse puts the loss at £139 million a year; this analysis gives £116 million. Both are reasonable. They count different things, and each answers a different question.
Three ways to count
Gross removals. NHS England figures reported by Pulse show just over a million patients removed from practice lists since list cleansing began in October 2025. At the gross Global Sum of £130.07 per patient, that is about £139 million a year.
Net change in registrations. This analysis uses the change in the total number of registered patients between the November 2025 peak and October 2026: a fall of 933,000. At the Global Sum net of the out-of-hours deduction, £123.96 per patient, that is about £116 million a year.
Change against the previous year. In the same months a year earlier, registrations grew by 250,000. Measured against that, the swing is 1.18 million registrations, or about £147 million a year.
Why the numbers differ
Not every removal is down to list cleansing. Patients are removed from lists every year: people die, move abroad, or are deducted for other routine reasons. In a normal year these are more than offset by births and new registrations, which is why the register usually grows. A count of removals alone does not separate routine removals from those caused by the new process. Unless reinstatements are subtracted, it also counts patients who were removed and later came back.
The rate matters too. Almost all practices have opted out of out-of-hours care and have £6.11 per patient deducted from the Global Sum. Using the gross rate of £130.07 overstates what practices actually receive by about 5%.
The comparison with the previous year comes closest to isolating the effect of list cleansing, because last year’s figures already include a normal year’s removals and registrations. But it assumes this year would otherwise have looked like last year. If registrations would have grown more slowly anyway, it overstates the effect.
Why this analysis uses the net figure
It is what practices are paid on. The Global Sum follows the registered list, so the net change is the change in funding practices actually see.
It allows for patients who came back. Anyone removed and then reinstated or re-registered by October 2026 is back on the list and is not counted as lost.
It needs no assumption about what would otherwise have happened. It is the observed change, not an estimate against a trend.
It can be split by practice. NHS England has not published removal or reinstatement counts by practice, so a gross figure cannot be broken down by deprivation. The net change in each practice’s list can.
So £116 million a year is a conservative figure. The effect of list cleansing itself is probably larger, nearer £139 million to £147 million on the other two measures.
What does not change
Every measure values each registration at the same flat rate, so the choice changes the size of the total, not how it is shared. On the net measure, the most deprived fifth of practices loses 28% of the funding and the least deprived 14%. Per registered patient, practices in the most deprived areas lose about twice as much as those in the least deprived. Against the previous year’s trend the gap is about one and a half times. Either way, the funding is being taken disproportionately from the practices with the greatest need.
Methods and sources
Monthly practice list sizes come from NHS England’s Patients Registered at a GP Practice (all-practice files, January 2020 to October 2026), as compiled in a public repository. Deprivation is the English Indices of Deprivation 2025 (LSOA 2021). Each practice takes the IMD score of the LSOA containing its main surgery postcode. This is not patient-weighted: practices whose patients live in mixed areas are partly misclassified, which would tend to understate the gradient.
Practices were ranked by IMD score and divided into fifths, and tenths, each holding an equal share of registrations at November 2025. The outcome is the net change in registrations, so it includes new registrations, deaths and moves as well as list-validation removals. The panel is the 6,123 practices present in all 24 months, less 93 with any month-on-month change above 15%, leaving 6,030 practices holding 62.1 million registrations at the peak. Confidence intervals for means and medians use 4,000 bootstrap draws. Regression standard errors are clustered by ICB, matched on ICB code, or by local authority; the October 2026 files list 36 ICBs.
Annual funding values are the difference between the November 2025 and October 2026 lists multiplied by the 2026/27 Global Sum of £130.07 per weighted patient less the £6.11 out-of-hours deduction. At the gross rate the national figure is £121 million. Income already lost sums each month’s shortfall below the November 2025 list from December 2025 to October 2026 at one twelfth of that rate. Both measures exclude QOF, PCN funding, enhanced services and the London adjustment, and value every registration at the national average weight.
Policy context comes from NHS England’s list validation guidance, the BMA, GPonline, Patient Safety Learning and Management in Practice. The derived tables are published with this post: by fifth, by tenth, by region, robustness checks and per practice.
This is an analysis of published aggregate data, not clinical advice. It does not establish causation and does not describe what happened to any individual patient. Happy to share the underlying data with anyone who wants to pick it apart.