Moving points around QOF is one of the few things in the GP contract that reliably changes what gets done. The 2025/26 data show it working in both directions at once.
For 2025/26, NHS England permanently retired 32 QOF indicators that had been income-protected in 2024/25, releasing 212 points. Of those, 141 were redistributed across nine cardiovascular prevention indicators, whose achievement thresholds were raised at the same time, and 71 were removed outright and reinvested in the Global Sum and other contract items. The stated aim was to support the government’s ambition to reduce premature mortality from heart disease and stroke by 25% within a decade. NHS England set out the changes in the 2025/26 GP contract.
None of that was new QOF money. The reweighting was funded entirely by the retirement: 212 points released, 141 moved to cardiovascular prevention, 71 taken out of QOF altogether. QOF finished the year 71 points smaller than it started, at 564. So there are two things to look at, not one.
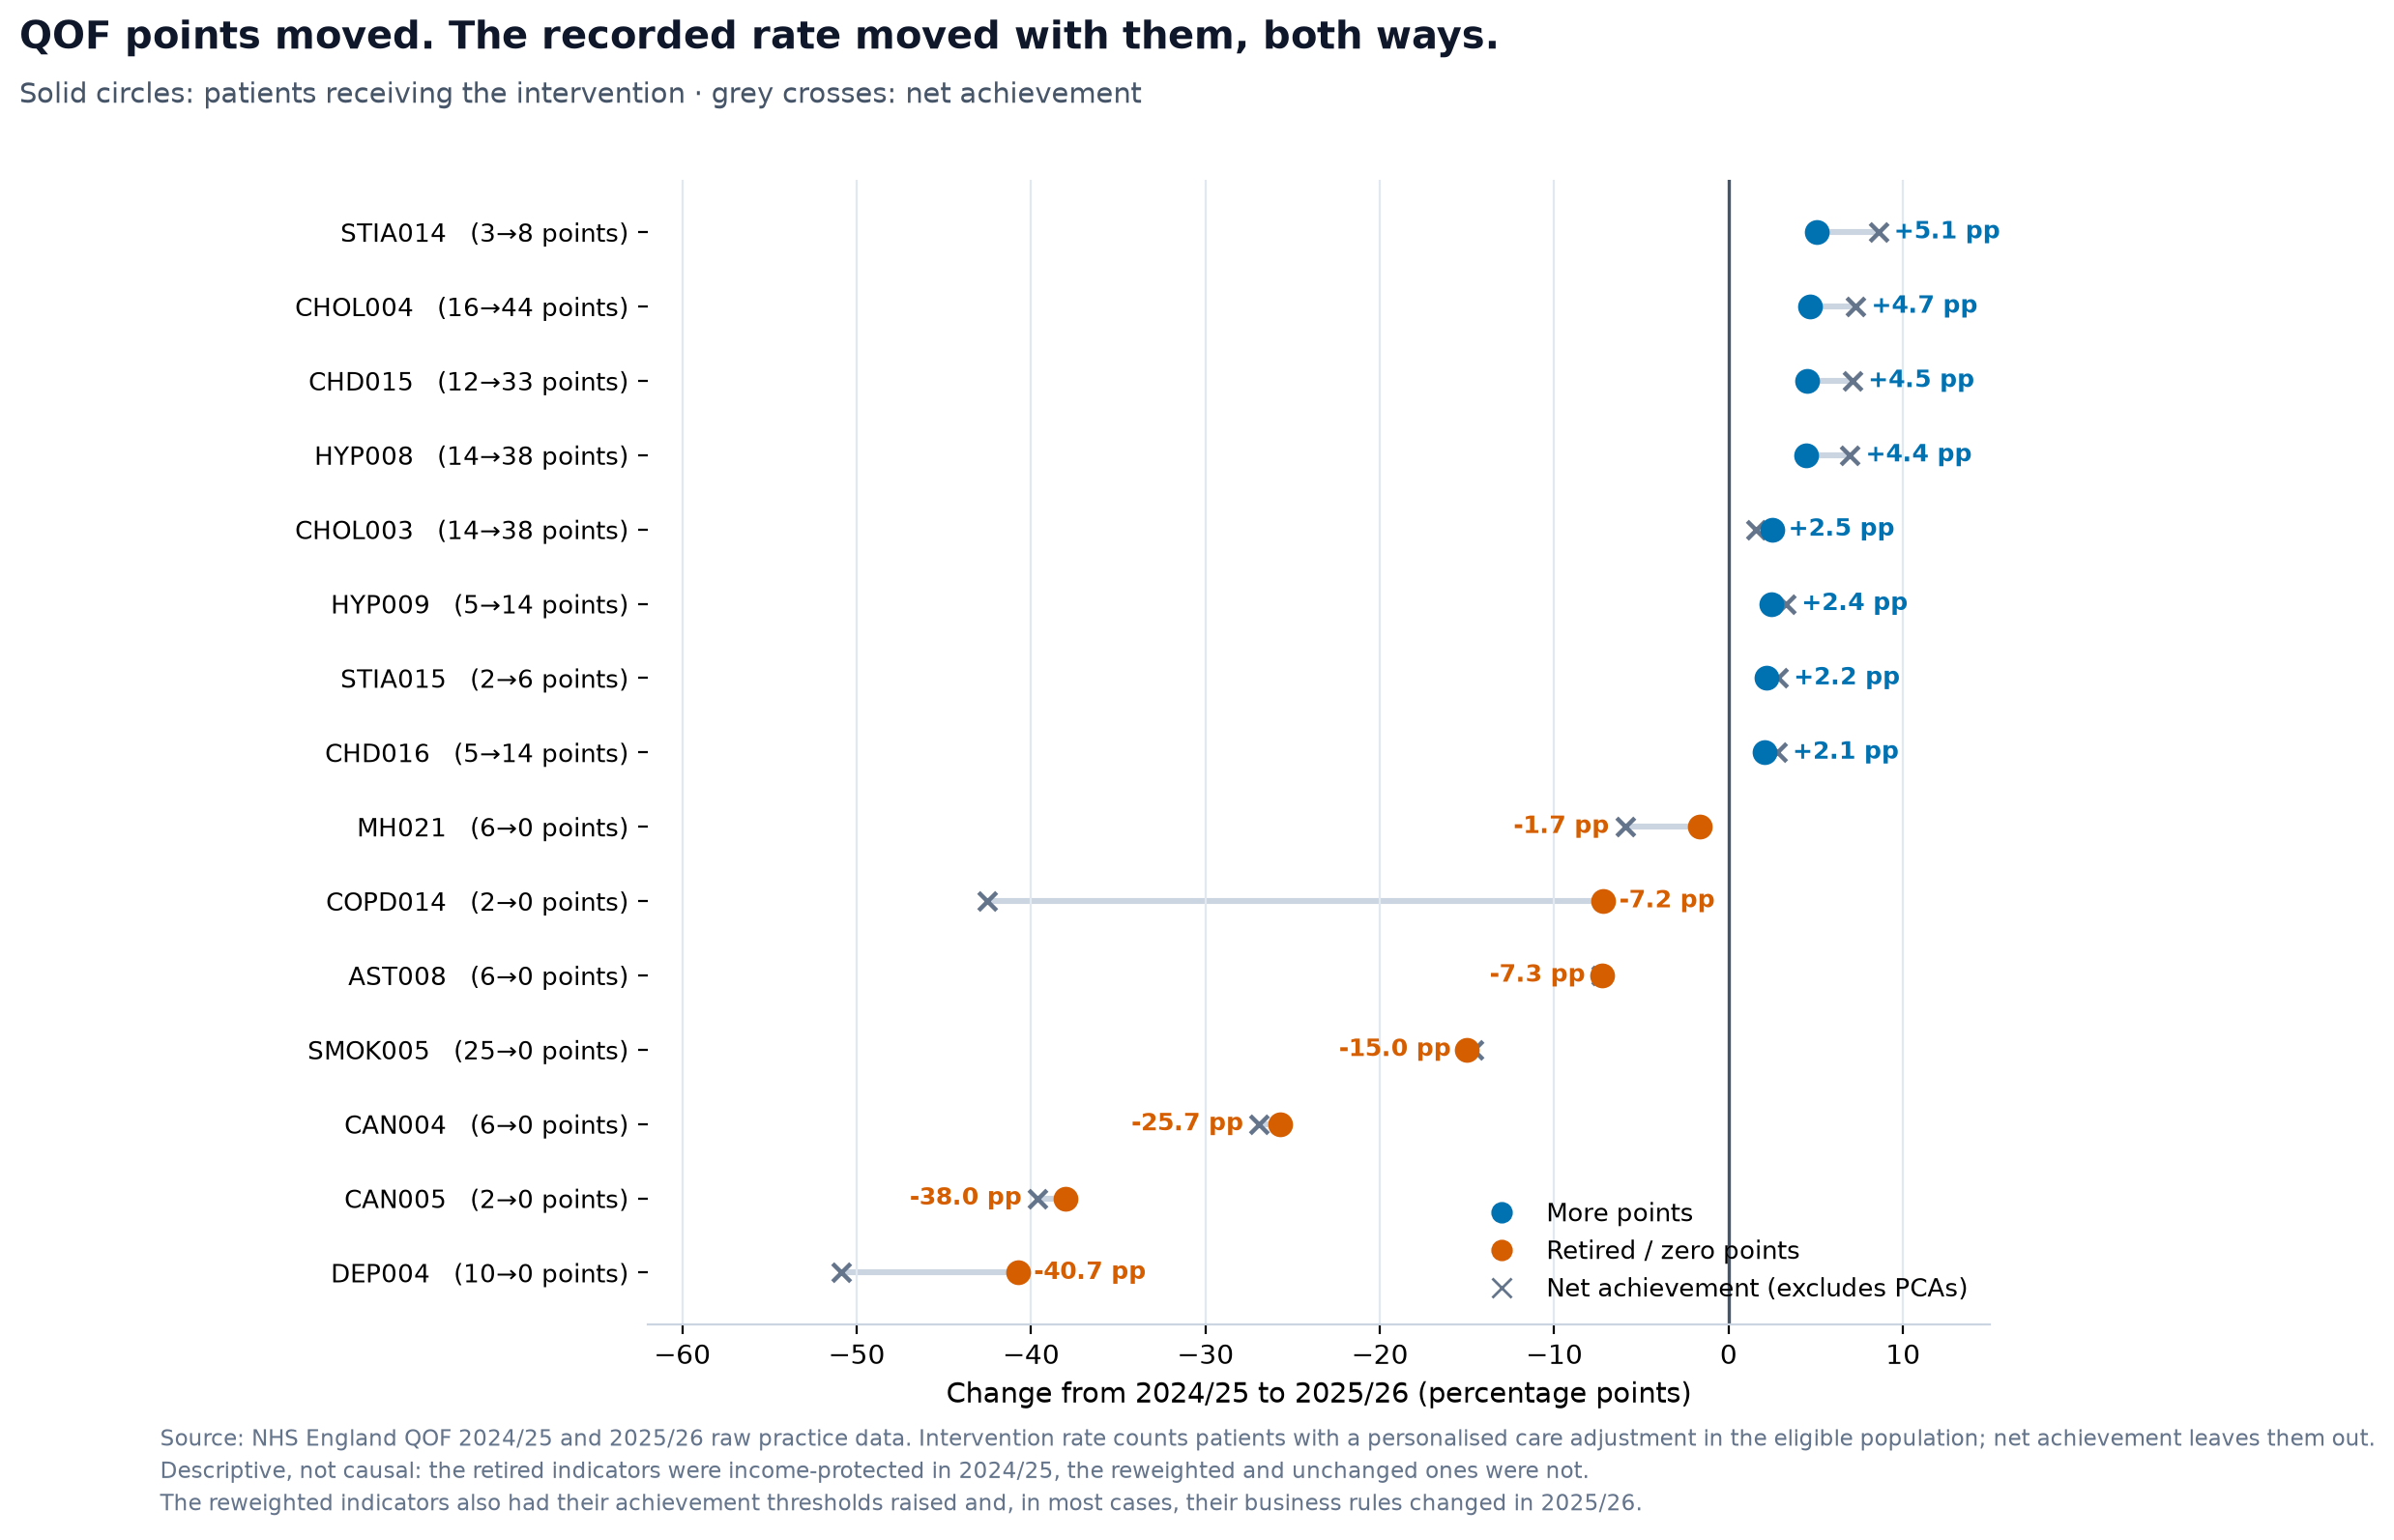
Across 46 indicators that can be compared directly between the two years, the eight reweighted CVD indicators improved by a median 3.5 percentage points and the seven comparable retired indicators fell by a median 15.0 points. The 31 whose points did not change stayed flat.
The short answer
Put points, recall and reporting behind something and practices respond within a year. Take them away and the recorded rate falls, at roughly four times the speed. The 31 untouched indicators are what make that a comparison rather than an impression: same practices, same year, same measure, no movement.
This is descriptive, not causal: the reweighted indicators also had their achievement thresholds raised and, in most cases, their business rules changed in the same year, and one year cannot separate payment from a moved goalpost from clinical effort from definitions. The symmetry between the two halves is still worth taking seriously.
01
A positive year for CVD prevention
Eight of the nine reweighted indicators can be compared directly with 2024/25. All eight moved in the right direction.
| Indicator | Points | Change |
|---|---|---|
| STIA014: BP ≤140/90, age ≤79 | 3 → 8 | +5.1 pp |
| CHOL004: cholesterol treated to target | 16 → 44 | +4.7 pp |
| CHD015: BP ≤140/90, age ≤79 | 12 → 33 | +4.5 pp |
| HYP008: BP ≤140/90, age ≤79 | 14 → 38 | +4.4 pp |
| CHOL003: lipid-lowering therapy | 14 → 38 | +2.5 pp |
| HYP009: BP ≤150/90, age ≥80 | 5 → 14 | +2.4 pp |
| STIA015: BP ≤150/90, age ≥80 | 2 → 6 | +2.2 pp |
| CHD016: BP ≤150/90, age ≥80 | 5 → 14 | +2.1 pp |
The improvement was widespread rather than concentrated in a few practices. Among practices with valid observations in both years, 83% improved on HYP008, 81% on CHD015 and 79% on STIA014.
That matters. Better blood pressure control reduces the risk of stroke, heart attack, heart failure and vascular death. More intensive lipid lowering in people with established cardiovascular disease reduces the chance of another event. QOF data cannot tell us how many events were prevented, but they show that more people were recorded at targets associated with lower cardiovascular risk.
The ninth indicator
The ninth reweighted indicator is DM036, blood pressure of 140/90 mmHg or less in people with diabetes aged 79 or under. At 27 points it received the second-largest single award of the 141, behind only CHOL004.
It is missing from the table above because it cannot be compared cleanly. DM036 replaced DM033, which carried 10 points and covered people with diabetes of all ages. Removing the over-80s changes the population, not just the payment.
DM036: the percentage rose, the patient count fell
Taken at face value, the recorded rate rose from 74.7% to 78.5%, a gain of 3.7 points, in line with the eight comparable indicators.
But the count of patients behind it fell by 2.6%. Fewer people with diabetes had a blood pressure recorded at target in 2025/26 than in 2024/25. The percentage rose because the harder-to-control over-80s no longer count towards it.
Two other diabetes CVD indicators, DM034 and DM035, covering statin treatment, kept their points unchanged and rose by 1.8 and 2.5 points.
The bar moved as well as the money
Points were not the only thing that changed. The upper achievement threshold, the level at which a practice earns all the available points, rose on eight of the nine reweighted indicators. Every lower threshold stayed where it was.
| Indicator | Upper threshold | Points |
|---|---|---|
| STIA014 | 73% → 90% | 3 → 8 |
| CHOL004 | 35% → 50% | 16 → 44 |
| CHD015 | 77% → 90% | 12 → 33 |
| HYP008 | 77% → 85% | 14 → 38 |
| CHOL003 | 95% → 95% | 14 → 38 |
| HYP009 | 80% → 85% | 5 → 14 |
| STIA015 | 86% → 90% | 2 → 6 |
| CHD016 | 86% → 90% | 5 → 14 |
| DM036 | 78% → 90% | 10 → 27 |
That muddies the simple version of this. Within these eight, the size of the threshold rise tracks the improvement more closely than the size of the points increase does: a Spearman correlation of 0.85 against 0.35. STIA014 received the smallest point increase of the eight, the largest threshold rise, and improved the most. CHOL003 received one of the largest point increases, was the only one whose threshold did not move, and improved least of the four indicators that gained more than 20 points.
Eight indicators is far too few to lean on a correlation, and points and thresholds moved together, so nothing here separates them. But the contract raised the bar and the payment at the same time, and the bar may be doing as much of the work.
The rule changes
CHOL004 deserves a closer look, but it is not the only indicator with a technical change. Its points increased from 16 to 44, its upper achievement threshold rose from 35% to 50%, and the proportion recorded at target rose from 48.2% to 52.8%, with 11.6% more patients recorded at target. Its business rule also changed: CHOL004 now uses the most recent cholesterol measurement in the previous 12 months, with LDL taking priority when LDL and non-HDL are recorded on the same latest date.
The six blood pressure indicators in the table also had a change to which measurement takes precedence. So six of the eight rows above, plus DM036, reflect some combination of treatment, recording, a raised bar and revised definitions. The direction of travel is consistent across all of them, and consistent with the flat control group, but no single indicator’s figure should be read as a pure measure of clinical improvement.
02
Groundwork for more ambitious prevention
Current QOF targets may not be the final destination. CHOL004 counts LDL cholesterol of 2.0 mmol/L or lower, or non-HDL cholesterol of 2.6 mmol/L or lower, as success in people with coronary heart disease, peripheral arterial disease or stroke/TIA.
The 2025 focused update of the ESC/EAS dyslipidaemia guidelines confirmed an LDL goal below 1.4 mmol/L, with at least a 50% reduction from baseline, for people at very high cardiovascular risk. This generally includes people with established atherosclerotic cardiovascular disease.
There is a similar gap in blood pressure. QOF rewards a clinic reading of 140/90 mmHg or lower for most people aged 79 or under. The 2024 ESC guideline on elevated blood pressure and hypertension recommends an on-treatment target of 120 to 129/70 to 79 mmHg for most adults when tolerated, with individualisation for frailty, symptoms and treatment tolerance.
QOF should not simply copy international targets without NICE review, attention to treatment burden and enough capacity in primary care. However, the work behind this year’s gains, including searches, recall systems, home blood pressure pathways and medication reviews, could prepare the ground for more ambitious targets if UK guidance moves in that direction.
03
Personalised care adjustments change the size, not the direction
Net achievement leaves patients with a personalised care adjustment (PCA) out of the count altogether. That can overstate how much of the eligible population is recorded at target. The main measure used here counts them, which NHS England describes as the percentage of patients receiving the intervention.
On this all-patient measure, HYP008 improved by 4.4 points, compared with 7.0 for net achievement. The corresponding figures were 4.5 and 7.1 for CHD015, and 5.1 and 8.6 for STIA014. Across all eight comparable reweighted indicators, the median gain was 3.5 points on the all-patient measure and 5.1 points on net achievement.
It does not run the same way everywhere. CHOL003 is the exception: its PCA rate fell by 1.4 points, so its net achievement gain of 1.6 points was smaller than its all-patient gain of 2.5. Exception reporting inflates most of the headline CVD figures, but not all of them, and it is worth checking the direction before assuming it.
The positive story remains either way. Exception reporting explains part of its apparent size.
04
The other side of the exchange
Everything above is the lever pulled towards cardiovascular prevention. This is the same lever, pulled away from everything that paid for it.
Of the 32 retired indicators, most were register counts or quality-improvement modules with no comparable rate. Seven were rate indicators that could be compared directly. Every one fell.
| Retired indicator | 2024/25 | 2025/26 | Change |
|---|---|---|---|
| Depression review after diagnosis (DEP004) | 64.7% | 24.0% | −40.7 pp |
| Early support discussion after cancer diagnosis (CAN005) | 83.6% | 45.6% | −38.0 pp |
| Structured cancer care review (CAN004) | 90.1% | 64.4% | −25.7 pp |
| Offer of smoking support and treatment (SMOK005) | 94.2% | 79.2% | −15.0 pp |
| Smoking-status recording in younger people with asthma (AST008) | 78.8% | 71.5% | −7.3 pp |
| COPD pulmonary-rehabilitation referral (COPD014) | 22.6% | 15.4% | −7.2 pp |
| Six-part physical health check in severe mental illness (MH021) | 68.0% | 66.4% | −1.7 pp |
These were clinically important. Depression reviews identify ineffective treatment, adverse effects and suicide risk. Cancer reviews support patients after diagnosis. Smoking interventions tackle a major cause of illness, and smoking recording in young people with asthma identifies risk. Pulmonary rehabilitation improves breathlessness and quality of life. Severe mental illness checks identify cardiovascular and metabolic risk in a group with a marked mortality gap. Current guidance supports these aims: depression, cancer care, pulmonary rehabilitation, tobacco treatment and physical health checks.
Was the 2024/25 baseline real?
The obvious challenge. These seven indicators were income-protected in 2024/25, so practices were paid for them regardless of what they achieved. NHS England warns that 2024/25 achievement for income-protected indicators may not represent activity in that year. If the baseline is inflated, the fall is an artefact.
Income protection covered only the 32 indicators being retired. The nine reweighted CVD indicators and the 31 whose points did not change were incentivised normally in both years, so the comparison group is untouched by it.
What the pre-period check shows
Comparing 2023/24 with 2024/25, when the indicators were still in QOF but payment had been protected, the median practice-level change was zero for AST008, CAN004, CAN005, COPD014 and SMOK005, −0.8 points for DEP004 and −0.2 points for MH021. The protected year looked almost exactly like the properly incentivised year before it.
The collapse only arrives in the year the indicators were actually retired, when the same practice-level medians fall by 4.7 to 56.0 points. Income protection did not move these numbers. Retirement did.
What the falls do and do not show
None of the released funding was ring-fenced to keep any of these processes going. The duty to provide the care remains. The searches, the recall runs and the feedback loop that made it systematic do not reappear anywhere else on their own.
Recording is not the same as care. A fall can reflect less activity, less coding, changed practice searches, altered use of personalised care adjustments, or all four at once. When an indicator is retired, the specific structured-template codes it depended on stop being the natural way to record the work, even where the work still happens. This is a real limit on what these numbers can prove, and it applies most strongly to process indicators that depended on a particular code, such as the two cancer reviews.
The individual falls need reading with some care. Depression review and both cancer indicators had sharp falls in all-patient rates and in the number of patients recorded, of 60%, 44% and 38%, which is harder to explain by coding drift alone. COPD014 is different: net achievement fell by 42.5 points, compared with 7.2 on the all-patient measure, because PCA use was very high. The number of patients referred still fell by 31%. For MH021, the all-patient rate fell by 1.7 points and the number of patients checked was almost unchanged, so on the evidence here it is closer to holding steady than falling.
05
The warning from uACR
There is a useful historical precedent, though it comes with a serious caveat about the data.
DM005 paid for annual urine albumin:creatinine ratio recording in people with diabetes, and was last in QOF in 2013/14. CKD004 paid for annual urine ACR or PCR recording in people on the CKD register, and was last in QOF in 2014/15. Afterwards, both were reported voluntarily through the Indicators No Longer in QOF (INLIQ) collection.
| Indicator | Final QOF year | +1 | +2 | +3 | 2018/19 |
|---|---|---|---|---|---|
| DM005: urine ACR in diabetes | 80.6% (2013/14) | 62.1% | 58.3% | 59.1% | 63.1% |
| CKD004: urine ACR/PCR in CKD | 75.4% (2014/15) | 40.2% | 38.3% | 37.2% | 39.4% |
Recorded testing dropped sharply once payment stopped, and then sat well below its old level for years. Diabetes ACR recording settled around 58% to 59% for four years. CKD ACR/PCR recording settled around 37% to 39%.
Why these numbers are not a clean before-and-after
The national INLIQ report is blunt about this. NHS Digital advise against comparing the QOF and INLIQ figures directly, because the collection mechanisms differ: QOF was mandatory and paid, INLIQ was voluntary.
Only about 68% of practices submitted INLIQ data in 2018/19, down from 78% in each of the two preceding years, and practices that kept submitting had higher achievement than those that stopped. The report itself says this reporting bias may explain part of the apparent rise in the final year, which is why the 2018/19 figures are the least trustworthy in the table.
So the size of the drop is not a precise effect and should not be quoted as one. What is left is the shape: after the incentive went, the recorded rate fell a long way and stayed down for at least four years, across two separate indicators. The 2015/16 National Diabetes Audit, collected differently again, found the same broad pattern.
The uACR indicator mattered because the result changes clinical decisions. When assessing kidney function in diabetes and CKD, eGFR alone is not enough. Urine ACR helps classify CKD and estimate kidney and cardiovascular risk.
KDIGO’s 2024 CKD guideline recommends ACE inhibitors or ARBs for important groups with CKD and albuminuria. It also recommends SGLT2 inhibitors for adults with CKD and an eGFR of at least 20 ml/min/1.73 m² when urine ACR is at least 20 mg/mmol, as well as for people with heart failure regardless of albuminuria. SGLT2 inhibitors are also recommended for people with type 2 diabetes and CKD at an eGFR of at least 20.
Missing the urine test can mean missing someone at high cardiorenal risk whose treatment could change. The test remained useful and treatment became more effective, yet recorded testing stayed lower after the QOF incentive disappeared.
06
The bottom line
Strip out the cardiovascular framing and what is left is a fairly plain lesson about what QOF points do.
Put behind a priority, they work. The contract put more weight behind cardiovascular prevention and practices responded within a year, while the 31 untouched indicators did not move. That should mean fewer heart attacks and strokes, and the searches, recall systems and review processes built this year may make more ambitious targets achievable later. On its own terms the reinvestment worked.
Taken away, they work just as well in reverse. Processes that mattered clinically did not keep going at the same level once the funding, the recall system and the measurement went, or at least stopped being visible. Nothing was ring-fenced to keep them running, and the uACR history suggests they do not come back on their own.
The CVD gains are real and worth having, and cardiovascular prevention needed the investment. The cost is where it came from. Depression review, cancer care reviews, smoking support, pulmonary rehabilitation referral and physical health checks in severe mental illness have largely dropped out of national data, and the 2025/26 figures suggest several of them are not quietly carrying on unmeasured.
QOF does not just count the work. It pays for the scaffolding that makes the work systematic: the searches, the recall lists, the reporting back. Moving that scaffolding from one priority to another is a reasonable thing to do. Doing it without either funding a replacement or keeping some way of seeing what happens next is not.
Methods and sources
The analysis used NHS England’s practice-level QOF CSV files for 2023/24, 2024/25 and 2025/26. The primary rate was the number of patients meeting the indicator divided by the eligible population with personalised care adjustments left in, which NHS England describes as the percentage of patients receiving the intervention. Net achievement, the same count divided by the eligible population with those patients taken out, was secondary. The 2025/26 files cover 6,145 practices and the 2024/25 files 6,188, so practice-paired checks used only practices with valid observations in both years. Calculated hypertension prevalence of 15.764% reproduces the published 15.8%. Total QOF points fell from 635 to 564 across the two years, which is 635 less the 212 retired plus the 141 redistributed, so no points were created.
Indicators entered the main comparison on the same indicator code plus description similarity of at least 0.94, giving 46 indicators. CHOL004 was retained despite its wording and business-rule change, which is disclosed above rather than used as an exclusion. Renamed successor indicators were excluded from that comparison and reported separately: DM036 for DM033, DM034 for DM022, DM035 for DM023. Six of the eight comparable reweighted indicators, and DM036, also had blood pressure measurement precedence changes in 2025/26, so none of these figures isolates clinical improvement from recording or definitional change. 2023/24 was used as a pre-period check for the indicators income-protected in 2024/25. No patient-level data were used.
Historical DM005 and CKD004 figures come from the Indicators No Longer in QOF 2018/19 summary, Table 5. Other sources include the QOF 2025/26 official statistics, the technical annex, the data-quality annex and the 2025/26 GP contract changes.
Where this leads
Datim-QI exists to make this kind of question answerable for a single practice or PCN rather than only at national level: which indicators moved, how much of that is exception reporting, and where the recall work is worth doing next.
This is an analysis of published aggregate data, not clinical advice. It does not establish causation and does not describe what happened to any individual patient. Happy to share the underlying data with anyone who wants to pick it apart.