A first national primary-care snapshot finds a twofold gap between ICBs in recorded SGLT2 treatment for chronic kidney disease. London leads on the kidney and heart-failure measures, but not on diabetes, and that asymmetry is the most useful thing in the data.
The latest CVDPREVENT data add something we have not previously been able to see at this scale: how consistently primary care records the use of SGLT2 inhibitors in chronic kidney disease (CKD) and heart failure, and whether people with heart failure with reduced ejection fraction (HFrEF) are receiving all four pillars of disease-modifying treatment.
The results show a clear SGLT2 postcode lottery. Among patients meeting the recorded eligibility criteria, treatment varies substantially according to the ICB in which someone is registered.
Recorded treatment ranges from 25.0% in Cornwall and the Isles of Scilly to 51.5% in North West London. An eligible patient is therefore more than twice as likely to have received an SGLT2 inhibitor prescription in the highest-performing ICB as in the lowest. This scale of variation warrants action on patient identification, prescribing pathways and follow-up.
Among people in the March 2026 CVDPREVENT audit denominator with recorded CKD stages G3a to G5 who met the NICE eligibility criteria for SGLT2 inhibitor treatment, 33.4% had received an SGLT2 inhibitor prescription in the preceding six months. Across the 42 ICBs in the release, the recorded rate ranged from 25.0% to 51.5%. North West London and North Central London occupied the top two positions.
London also had the highest regional rate for recorded SGLT2 treatment in heart failure (65.1%, England 58.3%) and for all four HFrEF treatment pillars (46.4%, England 40.8%). But London was only around the national average for SGLT2 treatment in type 2 diabetes (33.7%, England 33.3%).
That last result changes the interpretation. This does not look like a simple story of younger patients, better-resourced practices or a capital-city prescribing culture. It looks more like particular CKD and heart-failure pathways working better in particular systems.
The short answer
Recorded SGLT2 treatment in CKD varies twofold between ICBs, and the same geography shows up, more weakly, in heart failure. The pattern is pathway-specific rather than a general London advantage, which points at operational things systems can copy: shared clinical rules, computable searches, funded reviews and pharmacist or nurse capacity.
These five measures are a first cross-sectional snapshot, not a trend. Higher means a larger proportion of the published audit denominator had treatment recorded. It does not by itself establish better prescribing, eligibility or outcomes.

01
The new measures
The CVDPREVENT March 2026 release reports routinely extracted, pseudonymised general-practice data. The five new measures examined here are set out below.
| CVDPREVENT measure | Numerator / denominator | England |
|---|---|---|
| CKD G3a to G5 treated with an SGLT2 inhibitor (CVDP008CKD) | 156,675 / 468,551 | 33.4% |
| Heart failure treated with an SGLT2 inhibitor (CVDP004HF) | 112,484 / 192,977 | 58.3% |
| HFrEF receiving all four pillars (CVDP003HF) | 51,265 / 125,546 | 40.8% |
| Type 2 diabetes treated with an SGLT2 inhibitor (CVDP006DM) | 1,207,003 / 3,626,807 | 33.3% |
| CKD, heart failure or type 2 diabetes treated with an SGLT2 inhibitor (CVDP001CVKM) | 1,331,543 / 4,012,905 | 33.2% |
CVDP008CKD measures the percentage of adults with recorded CKD G3a to G5 who meet the NICE criteria for an SGLT2 inhibitor and received a prescription in the preceding six months. The eligible group includes people with type 2 diabetes and people without type 2 diabetes who meet the relevant eGFR, albuminuria and ACE inhibitor or ARB criteria. In March 2026, 156,675 of 468,551 eligible patients were treated, an England rate of 33.4%.
There is some evidence of wider improvement in CKD and heart-failure processes between March 2025 and March 2026. Nationally, recorded annual albumin:creatinine ratio testing in CKD rose by 2.1 percentage points, eGFR monitoring in CKD by 1.2 points, and eGFR monitoring in heart failure by 2.8 points. These are related measures, not a time series for the new SGLT2 indicators.
02
A twofold gap in recorded CKD treatment
The CKD measure shows the starkest London pattern. North West London recorded 51.5%, North Central London 48.6%, North East London 44.1% and South East London 41.3%. South West London was 39.7%, still seventh of 42 ICBs. At the other end, Cornwall and the Isles of Scilly recorded 25.0%.
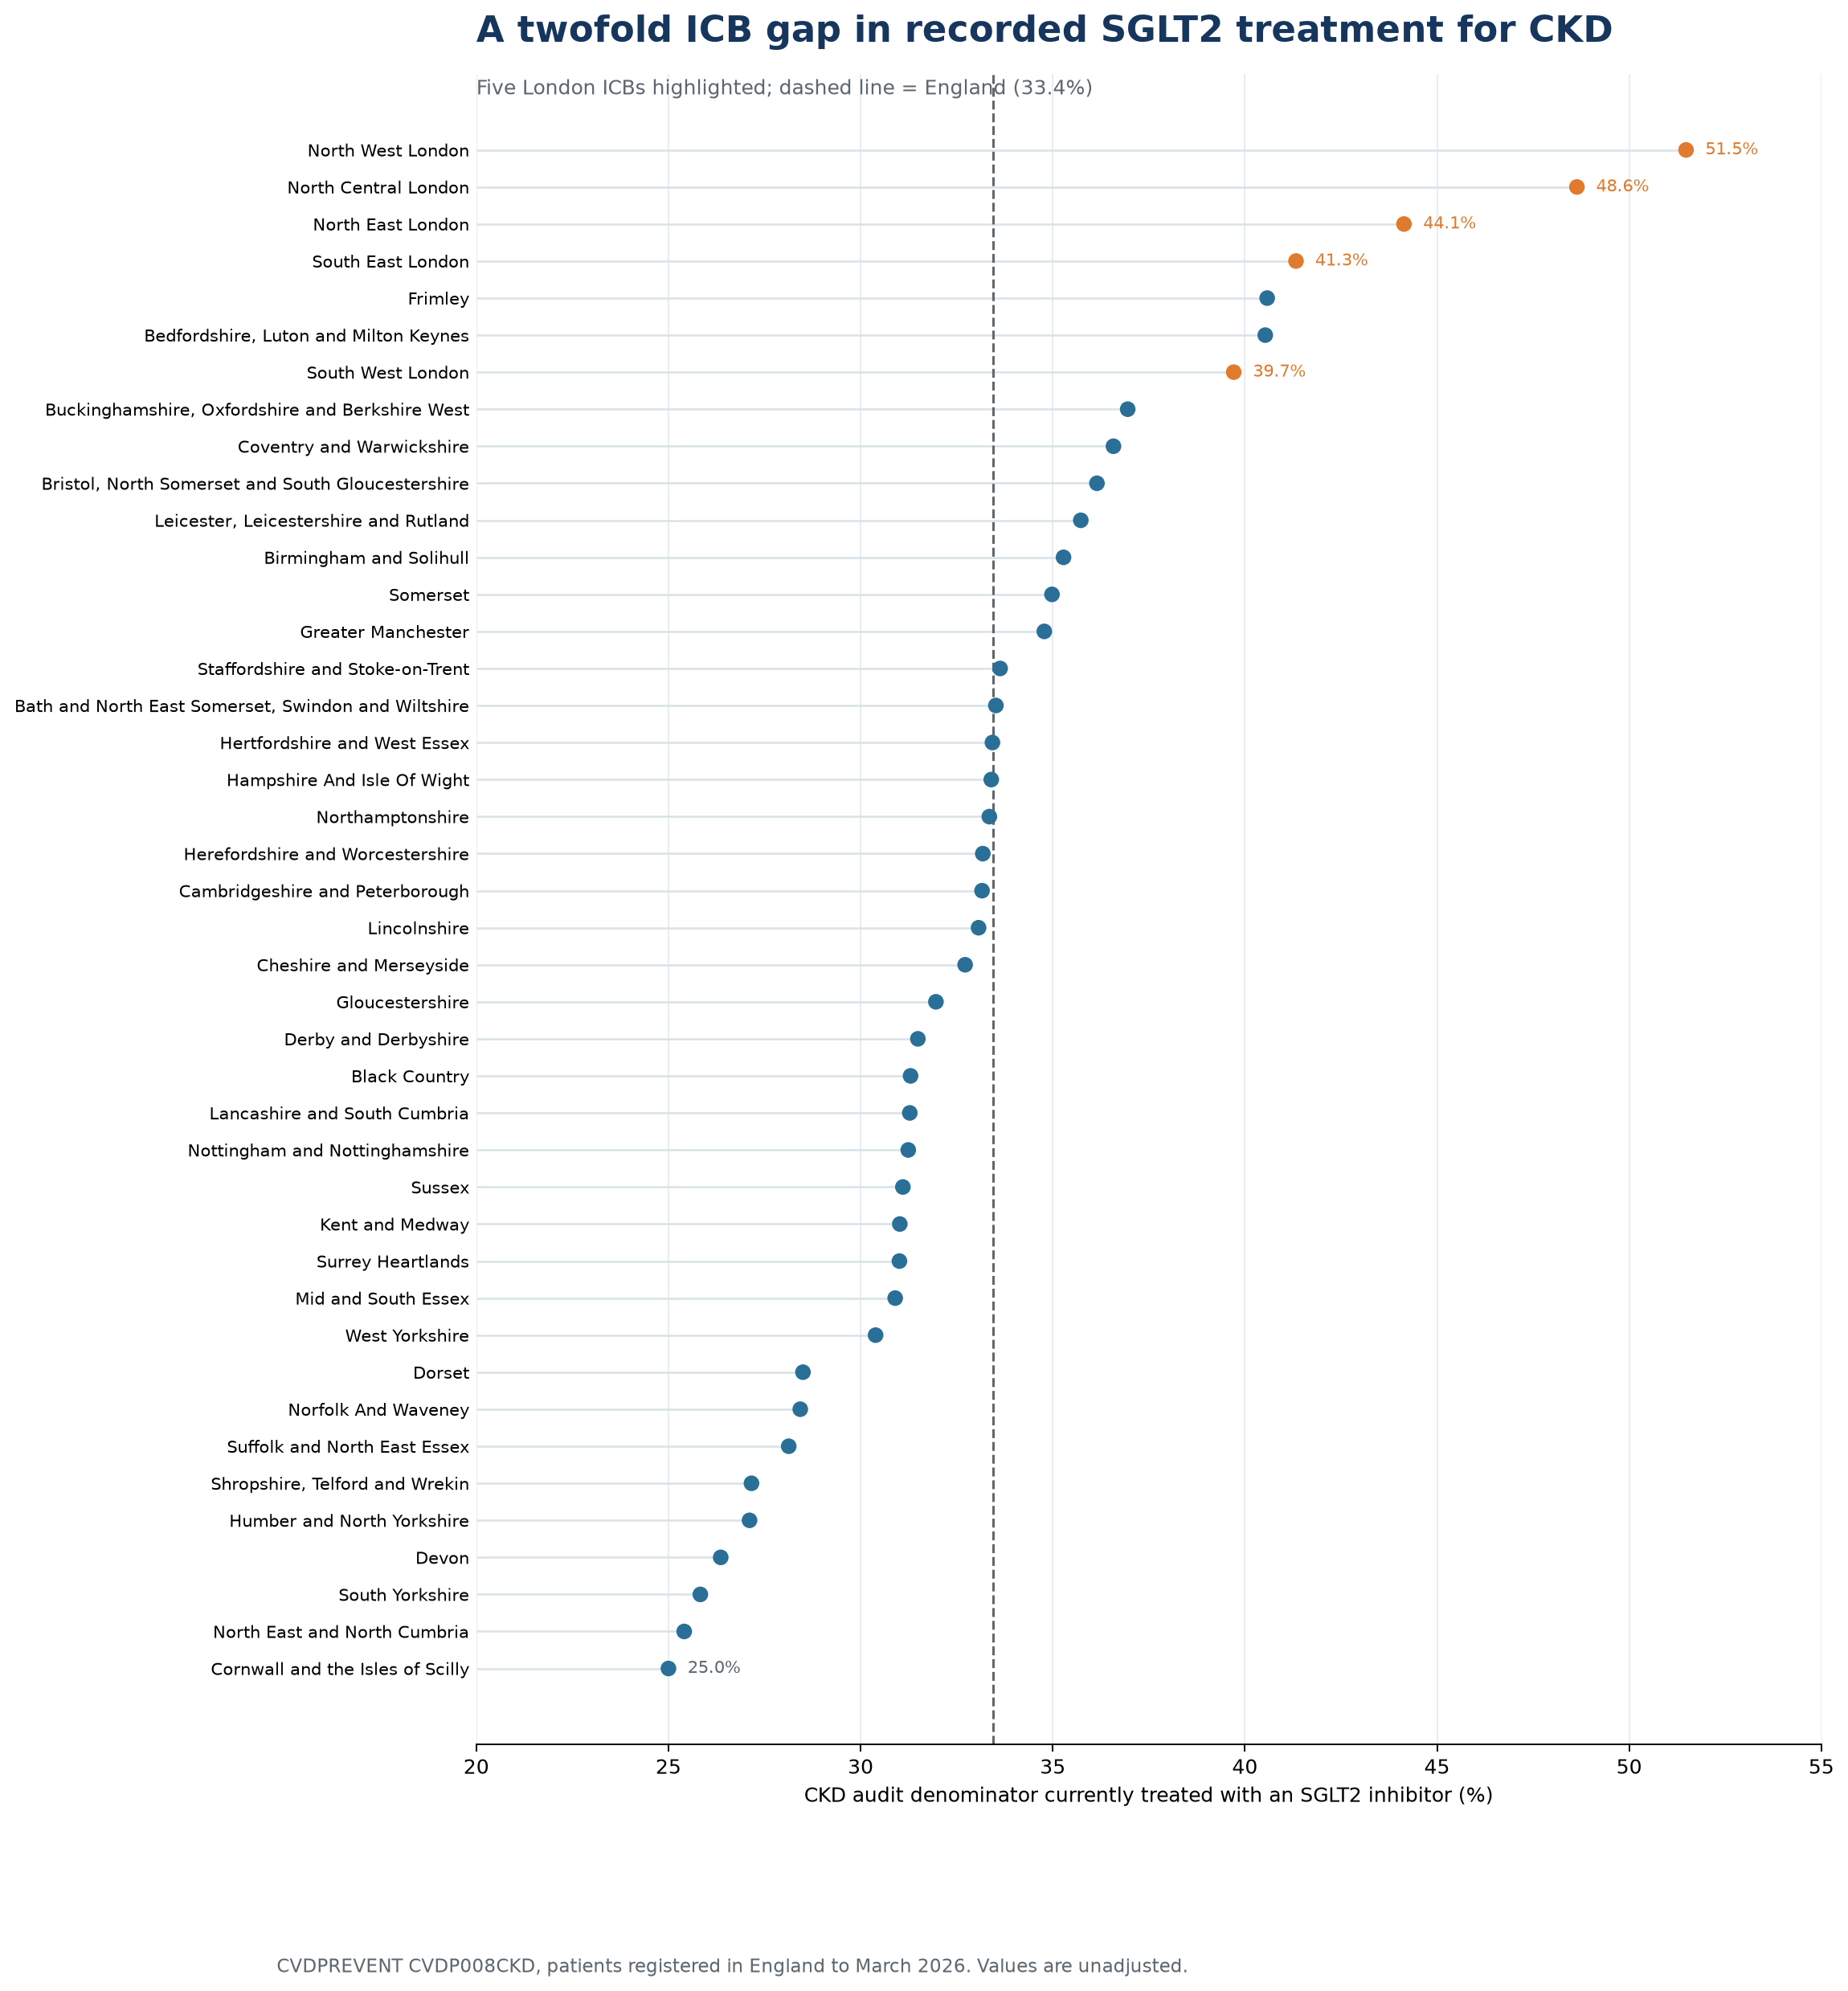
The regional weighted average was 45.5% in London, against 33.4% in the South East, 33.2% in the Midlands, 33.1% in the North West, 31.8% in the East of England, 30.8% in the South West and 27.2% in the North East and Yorkshire.
Similar, although not identical, geography appears in heart failure. ICB-level CKD SGLT2 rates were moderately associated with both heart-failure SGLT2 rates (Spearman r = 0.55) and four-pillar HFrEF treatment (r = 0.53). The association between the two heart-failure measures was stronger (r = 0.75). This is consistent with shared medicines-optimisation capacity, but ecological correlations cannot tell us why individual patients were or were not treated.
The four published age bands do not explain most of the pattern. Directly standardising each ICB to the England age mix changed recorded rates by no more than 2.8 percentage points across these four measures. Crude and age-standardised ICB ranks correlated between 0.98 and 0.99. North West and North Central London remained first and second for CKD, South East London remained first for the four HFrEF pillars, and it remained last for type 2 diabetes. Age adjustment strengthens the case for examining pathway differences, but it does not rule out other case-mix or coding effects.
03
London is not one prescribing system
Looking inside London prevents an over-neat conclusion.

North West London led the CKD measure and was fifth nationally for the type 2 diabetes measure, but ranked only 16th for all four HFrEF pillars. South East London led the country on four-pillar HFrEF treatment at 54.9% and was third for heart-failure SGLT2 treatment, yet recorded the lowest type 2 diabetes rate of all 42 ICBs at 28.2%. North Central London was second for CKD SGLT2 use but 29th for type 2 diabetes.
The composite measure is easily misread
CVDP001CVKM, which combines CKD, heart failure and type 2 diabetes, correlates almost perfectly with the type 2 diabetes measure alone (r = 0.98 across ICBs), because people with type 2 diabetes dominate its denominator. It is not a substitute for looking separately at the kidney and heart-failure pathways.
04
Why might London be doing better in CKD and heart failure?
The data cannot demonstrate causality, but London has several unusually visible pieces of delivery infrastructure that match the pattern and pre-date the March 2026 measurement period.
First, the London Kidney Network’s “3 within 3” pathway set out a common approach to identify CKD and complete key optimisation, including consideration of renin-angiotensin-system blockade, statins and SGLT2 inhibitors, within three months. Its primary-care searches and dashboard translate guidelines into actionable EMIS and SystmOne cohorts. That matters: a PDF formulary rarely changes care on its own, while a reliable search with named clinical responsibility often does.
Second, some ICBs funded delivery rather than relying on passive dissemination.
- North West London, the leading ICB, included CKD review and explicit assessment of SGLT2 need in its 2025/26 Single Offer enhanced service.
- North Central London ran a January 2025 to March 2026 commissioned CKD SGLT2 project, asking practices to find and review eligible untreated people with CKD G3a to G5, supported by training and searches.
- North East London formally supported system-wide adoption of an SGLT2-in-CKD pathway through its formulary and pathways group.
- South East London developed a practical CKD guide, while a later Health Innovation Network programme combined point-of-care testing with pharmacist- and nurse-led medicines optimisation.
- South West London launched an early-CKD programme and published practical SGLT2 guidance for CKD.
Together these suggest a plausible mechanism: shared clinical rules, population searches, funded reviews, specialist and primary-care agreement, and pharmacist or nurse capacity to initiate and monitor treatment. They also help explain why London’s advantage is pathway-specific rather than universal.
This remains a hypothesis
The policies differ in timing and coverage, other regions also have strong programmes, CVDPREVENT does not identify which intervention reached which patient, and case mix and coding may contribute materially. A stronger evaluation would use practice-level adoption dates, interrupted time series or difference-in-differences, linked to hospital and kidney outcomes.
05
The subgroup gaps deserve a closer look
Nationally, recorded treatment was consistently lower in women than men.
| Measure | Women | Men | Gap |
|---|---|---|---|
| CKD SGLT2 treatment | 26.8% | 40.0% | 13.2 pp |
| Heart failure SGLT2 treatment | 50.9% | 63.4% | 12.4 pp |
| HFrEF four pillars | 35.0% | 43.7% | 8.7 pp |
| Type 2 diabetes SGLT2 treatment | 28.4% | 37.2% | 8.8 pp |
Age explains some of the sex difference, but not most of it. After standardising women and men to the same national age mix, the gaps were 11.6 percentage points for CKD SGLT2 treatment, 10.2 points for heart-failure SGLT2 treatment, 6.2 points for the four HFrEF pillars and 8.0 points for type 2 diabetes. The corresponding crude gaps were 13.2, 12.4, 8.7 and 8.8 points.

| Measure | 18 to 39 | 40 to 59 | 60 to 79 | 80 and over |
|---|---|---|---|---|
| CKD SGLT2 treatment | 43.8% | 44.6% | 41.7% | 25.8% |
| Heart failure SGLT2 treatment | 61.9% | 67.1% | 63.8% | 50.1% |
| HFrEF four pillars | 52.5% | 55.2% | 45.9% | 27.5% |
| Type 2 diabetes SGLT2 treatment | 21.7% | 34.7% | 36.8% | 22.4% |
The age pattern is not a steady decline. CKD, heart-failure SGLT2 treatment and the four HFrEF pillars peak at ages 40 to 59, while type 2 diabetes peaks at 60 to 79. All four then fall sharply in people aged 80 and over. Type 2 diabetes is also low below age 40. The extract cannot distinguish appropriate non-treatment from missed treatment, so these results should lead to record review, not age-based targets.
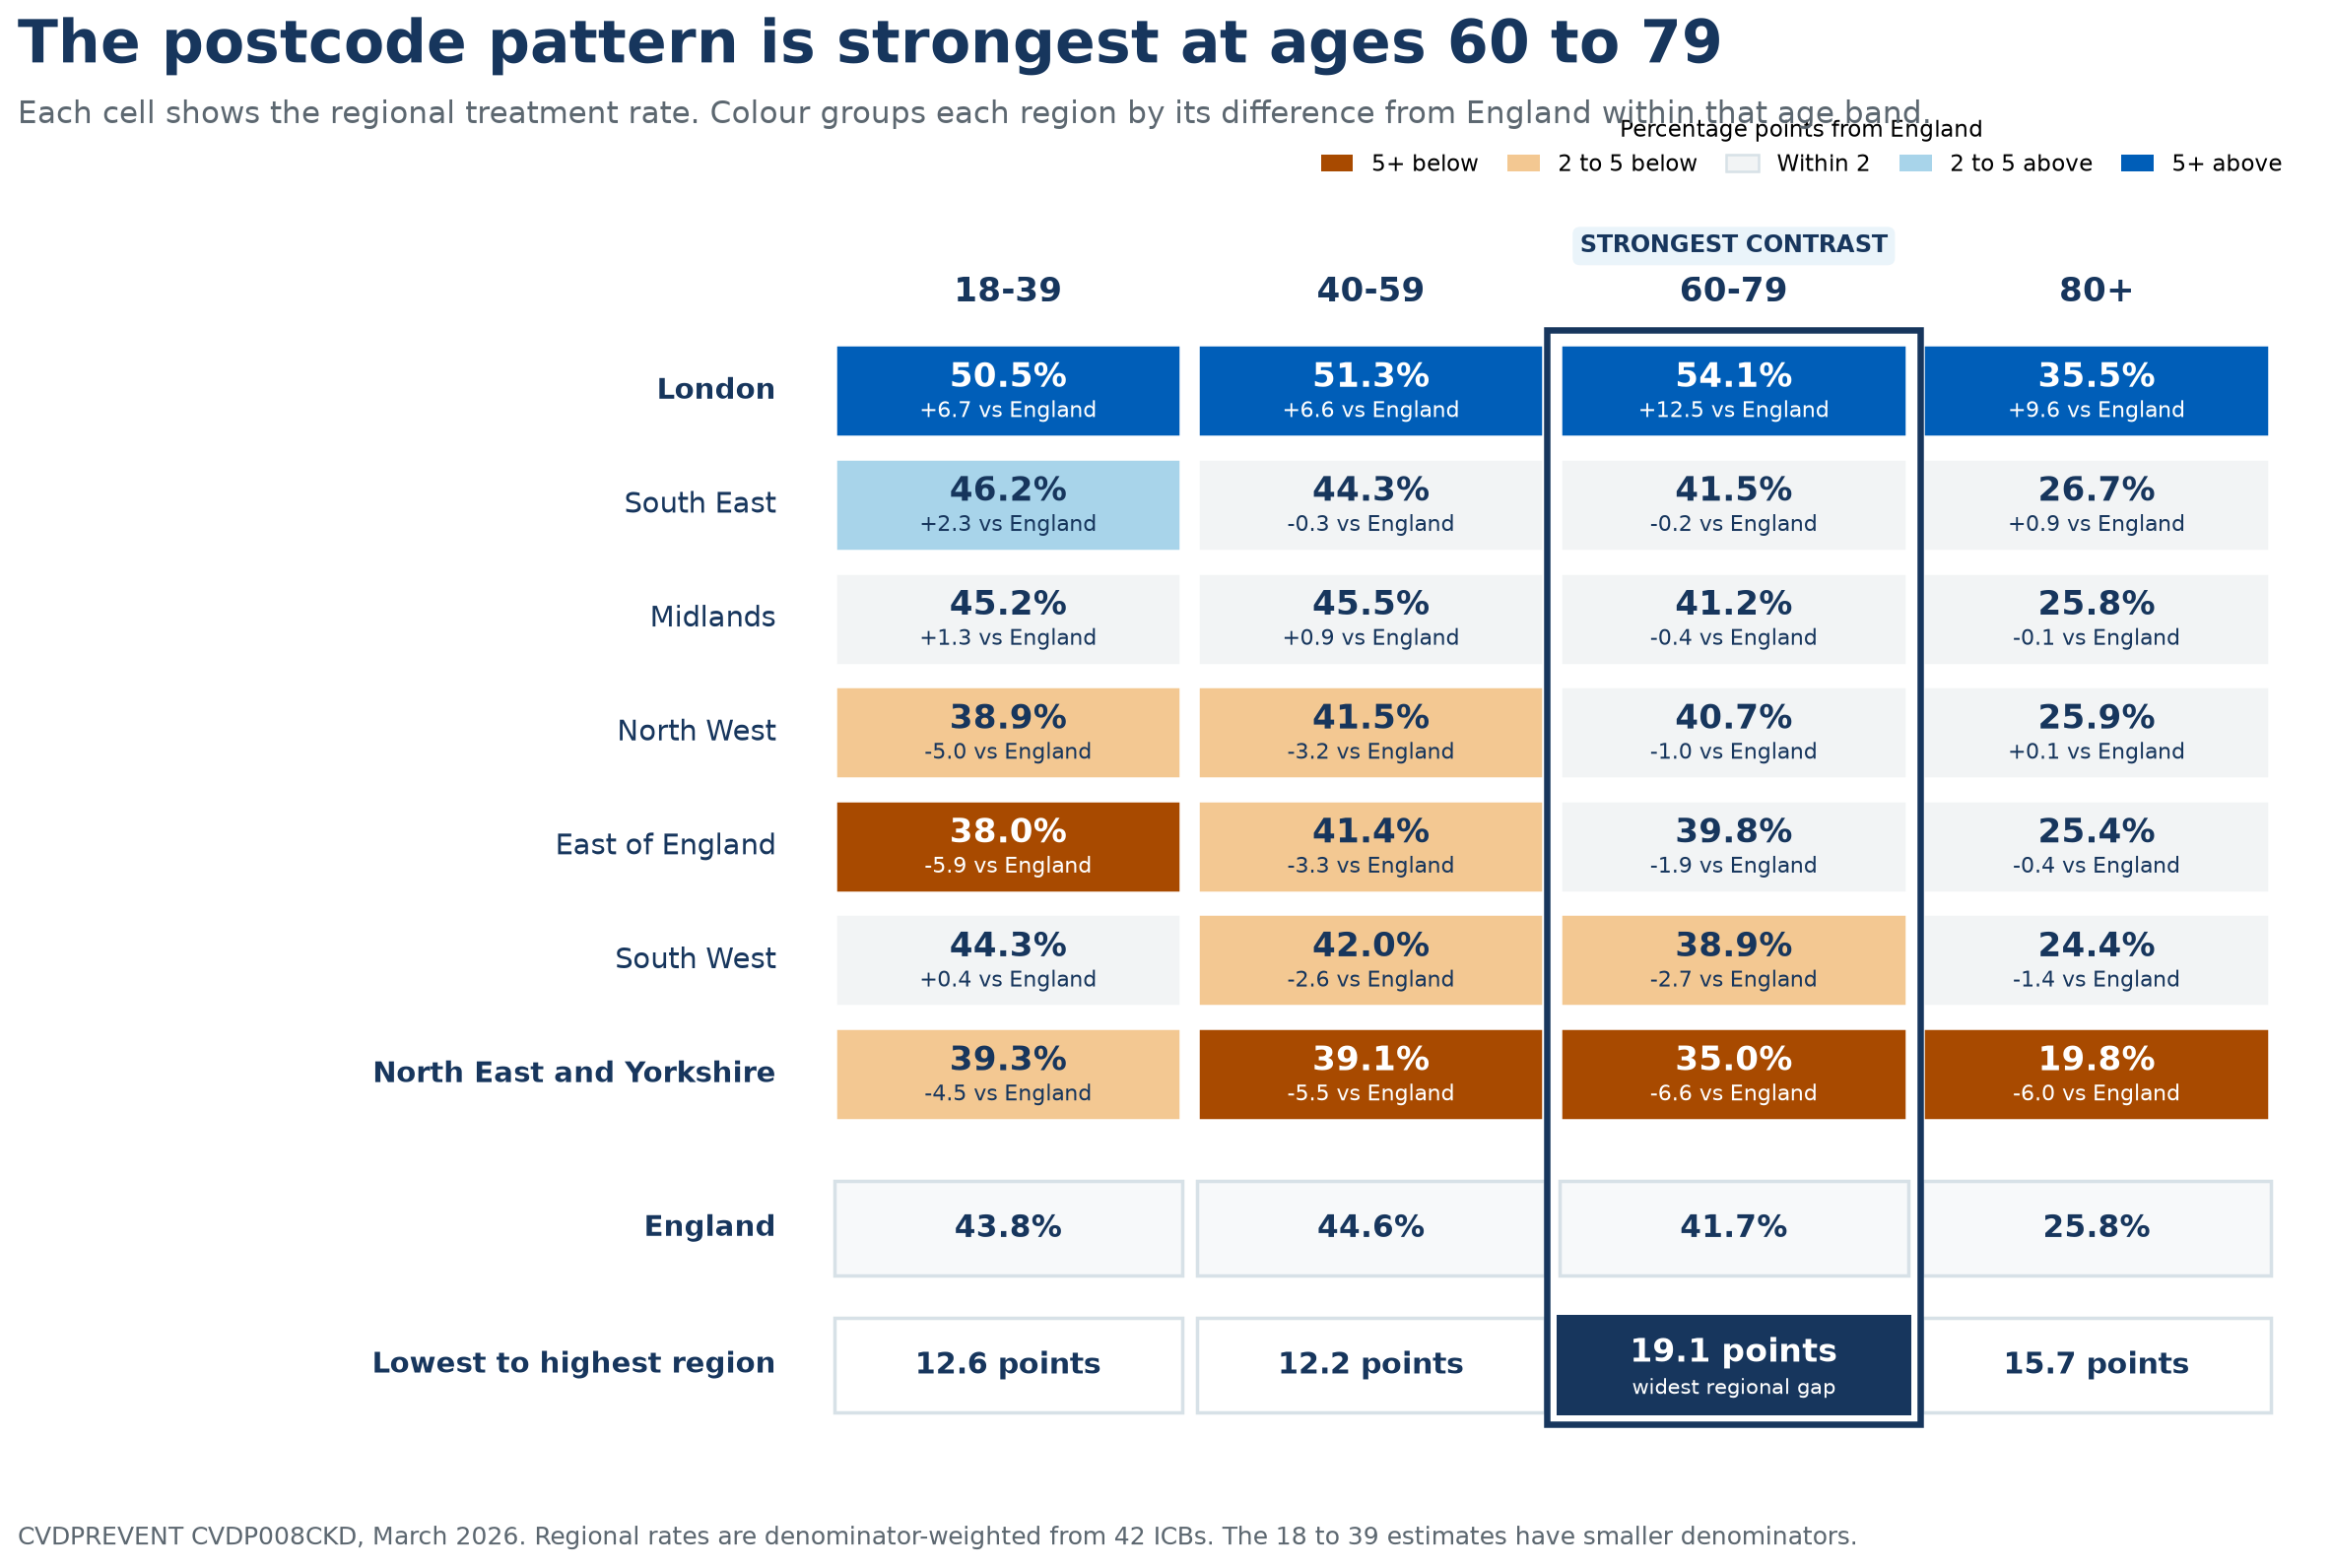
The national average also conceals an age-specific postcode gap. Among eligible patients aged 60 to 79, recorded CKD SGLT2 treatment ranged from 35.0% in North East and Yorkshire to 54.1% in London. The 19.1 percentage-point difference was the widest of any age band and affected a national eligible cohort of almost 187,000 people. Among people aged 80 and over, rates were lower in every region and ranged from 19.8% to 35.5%.
People recorded with severe mental illness had lower rates on each featured measure, for example 54.9% against 58.3% for heart-failure SGLT2 treatment and 29.3% against 33.4% for type 2 diabetes.
These are aggregate comparisons, with adjustment only for age where stated. In older age groups, frailty, low blood pressure, renal function, treatment burden and patient preference may make non-treatment appropriate. Sex differences may also reflect different disease phenotypes and coding. Even so, gaps this large justify stratified local review, especially review of whether eligibility, offers, declines and contraindications are being recorded consistently.
06
Why closing appropriate treatment gaps matters
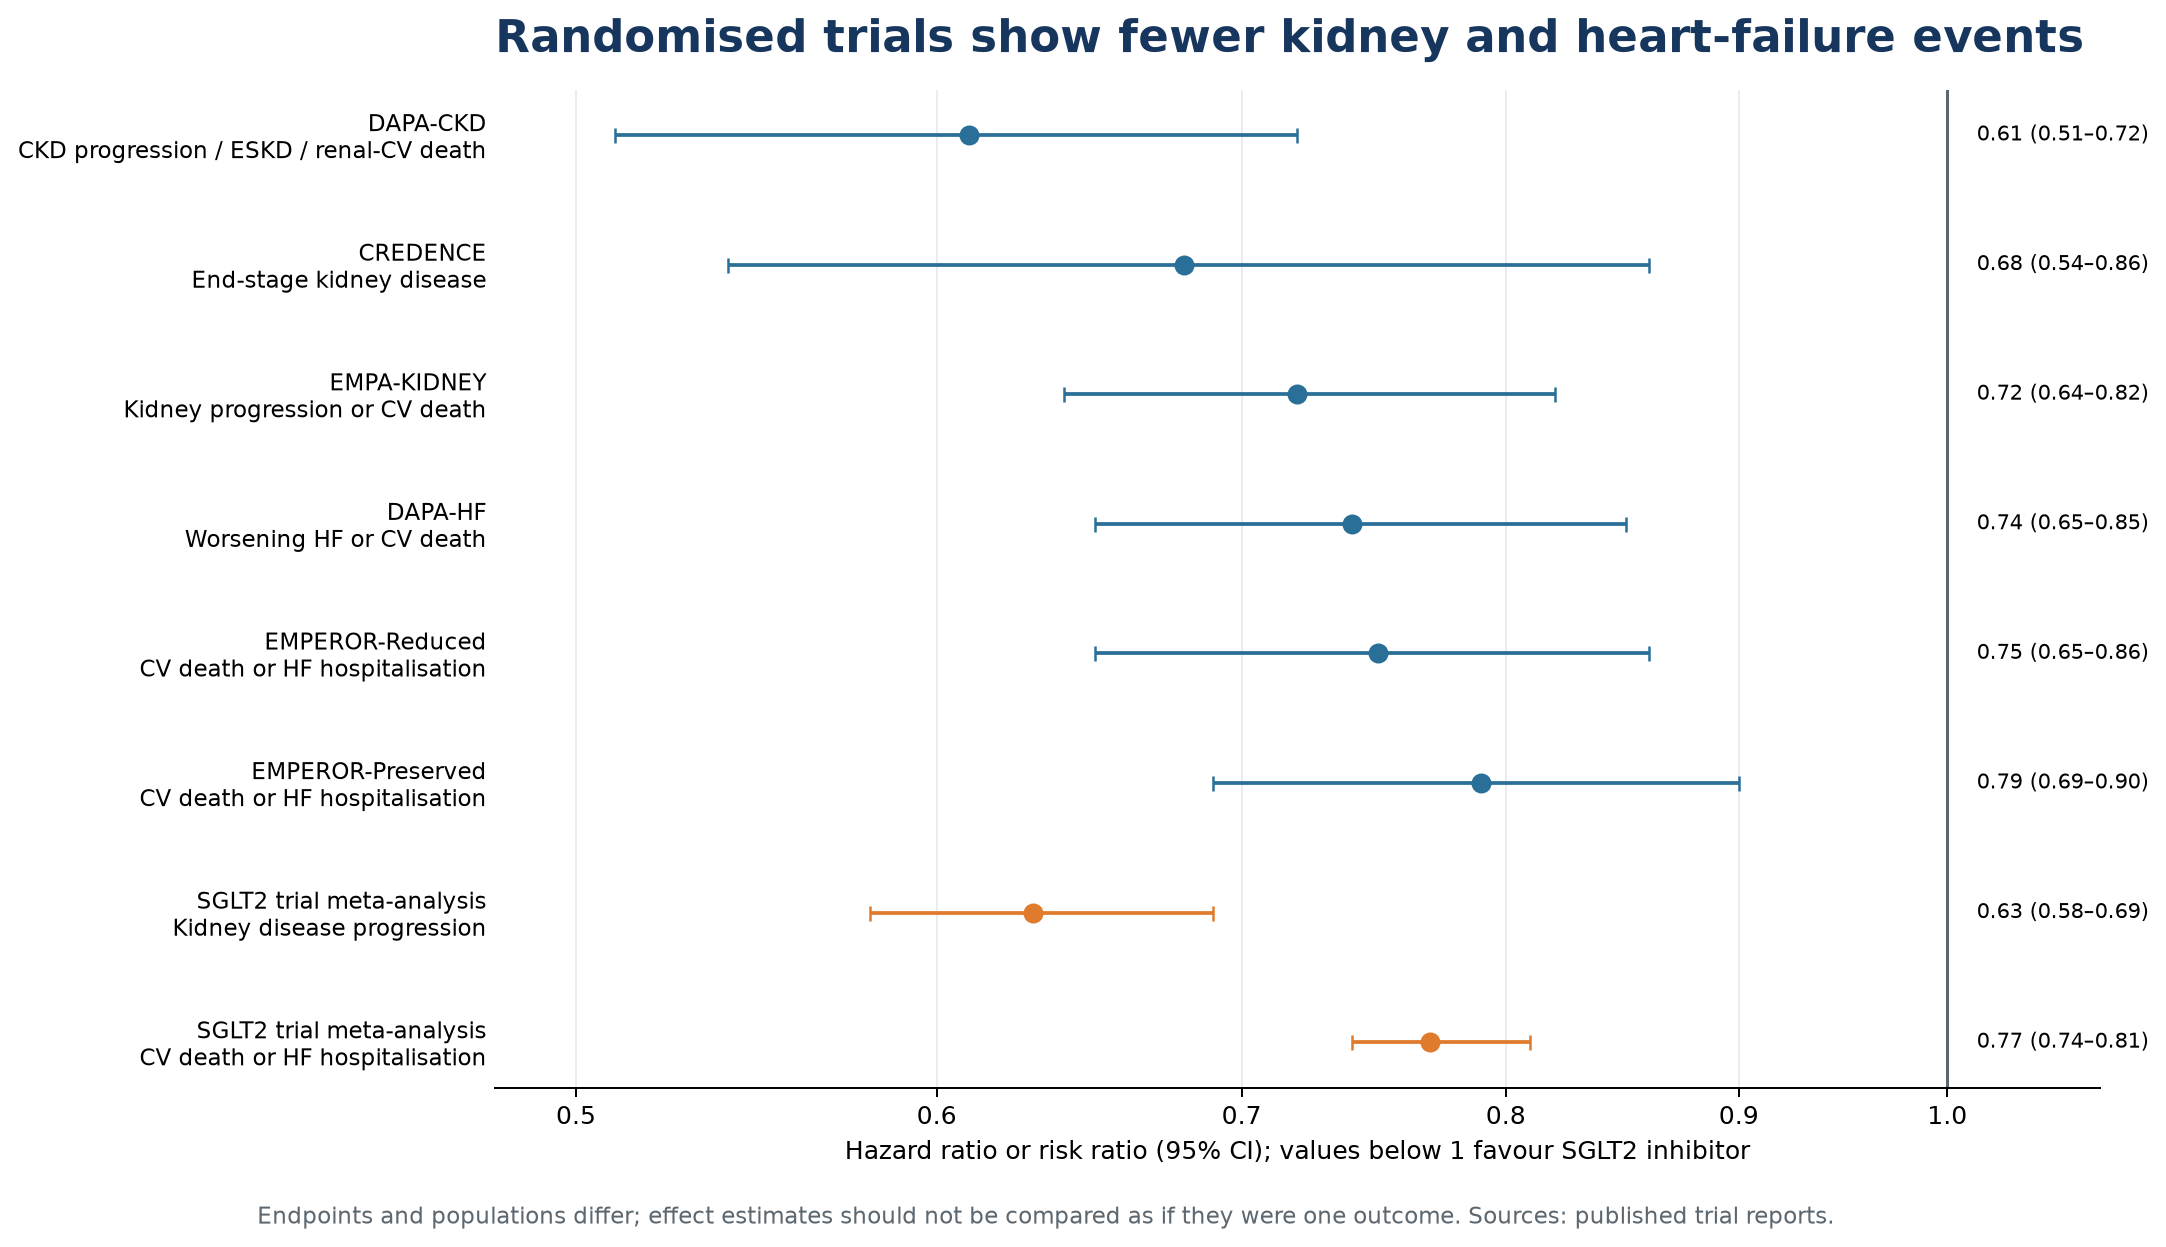
SGLT2 inhibitors are not simply glucose-lowering drugs. Trials in CKD and across the ejection-fraction spectrum of heart failure show clinically important reductions in kidney progression and heart-failure events, including in people without diabetes.
| Trial | Population and primary outcome | Result |
|---|---|---|
| DAPA-CKD | 4,304 people with CKD; sustained 50% or greater eGFR decline, end-stage kidney disease, or renal or CV death | 9.2% against 14.5%; HR 0.61 (0.51 to 0.72); NNT 19 over 2.4 years. CV death or HF hospitalisation HR 0.71; all-cause death HR 0.69 |
| CREDENCE | 4,401 people with diabetic CKD; kidney failure, doubling of creatinine, or renal or CV death | HR 0.70 (0.59 to 0.82). End-stage kidney disease HR 0.68; heart-failure hospitalisation HR 0.61 |
| EMPA-KIDNEY | 6,609 people with CKD; kidney progression or CV death | 13.1% against 16.9%; HR 0.72 (0.64 to 0.82). All-cause hospitalisation HR 0.86 (0.78 to 0.95) |
| DAPA-HF | 4,744 people with HFrEF; worsening heart failure or CV death | 16.3% against 21.2%; HR 0.74 (0.65 to 0.85). First worsening HF event 10.0% against 13.7%; HR 0.70 |
| EMPEROR-Reduced | 3,730 people with HFrEF; CV death or HF hospitalisation | 19.4% against 24.7%; HR 0.75 (0.65 to 0.86) |
| EMPEROR-Preserved | 5,988 people with HF and ejection fraction above 40%; CV death or HF hospitalisation | 13.8% against 17.1%; HR 0.79 (0.69 to 0.90); total HF hospitalisations HR 0.73 |
Preventing hospital admissions is one of the demonstrated benefits. In EMPA-KIDNEY, empagliflozin reduced all-cause hospitalisation by 14% relative to placebo. In DAPA-HF, dapagliflozin reduced the first worsening heart-failure event, defined as hospitalisation or urgent treatment requiring intravenous therapy, by 30%. DAPA-CKD also reduced the composite of heart-failure hospitalisation or cardiovascular death by 29%.
This is directly aligned with the Neighbourhood Health Service aim of preventing unnecessary hospital admissions and shifting care from hospital to community. A systematic primary-care pathway for identifying, offering and safely monitoring SGLT2 treatment is an evidence-based neighbourhood intervention to reduce preventable deterioration and hospital use.
A collaborative meta-analysis of 13 SGLT2 trials involving 90,409 participants found a 37% relative reduction in kidney disease progression (RR 0.63), a 23% reduction in acute kidney injury (RR 0.77), and a 23% reduction in cardiovascular death or heart-failure hospitalisation (RR 0.77). Relative effects do not translate into the same absolute benefit for everyone: baseline risk, kidney function, albuminuria and competing risks matter.
Current NICE heart-failure guidance recommends offering the four HFrEF pillars, that is an ACE inhibitor (or ARNI or ARB), a beta-blocker, a mineralocorticoid receptor antagonist and an SGLT2 inhibitor. NICE’s CKD guidance incorporates licensed SGLT2 options according to diabetes status, eGFR and albuminuria.
07
What should an ICB do with these data?
The most useful response is not a league table. It is to examine the delivery system behind the numerator.
- Reproduce the cohort locally. Confirm how the CVDPREVENT denominator maps to local searches and NICE eligibility. Separate apparently eligible and untreated from declined, contraindicated, already stopped, miscoded and needing specialist advice.
- Fix the prerequisites. Incomplete eGFR, urine ACR, ejection-fraction and diagnostic coding will break even a well-designed medicines pathway.
- Make responsibility explicit. Specify who offers, initiates, checks blood pressure and renal function, gives sick-day advice and follows up: general practice, specialist teams, community pharmacy or a shared model.
- Fund the work. London’s examples combine guidance with searches, protected clinical time and pharmacist or nurse capacity. Case-finding without capacity simply produces a longer list.
- Stratify, then review notes. Examine sex, age, ethnicity, deprivation, severe mental illness and learning disability, but do not infer inequity from unadjusted rates alone. Sample records to understand the mechanism.
- Measure the pathway, not just the prescription. Track identification, eligibility assessment, offers, starts, declines, intolerance, monitoring and persistence. Link to acute kidney injury, ketoacidosis, heart-failure admission and kidney-replacement outcomes where governance permits.
08
What this first snapshot tells us
CVDPREVENT’s new indicators show substantial geographical variation in recorded SGLT2 treatment and four-pillar heart-failure care. The twofold CKD gap shows a clear postcode lottery in treatment. London’s CKD and heart-failure lead is real in the published data, large enough not to be a rounding artefact, and broadly consistent across its five ICBs. It is not a universal London prescribing advantage.
The most credible working explanation is operational: common pathways, computable searches, funded reviews and multidisciplinary optimisation. That is encouraging, because those components can be copied. But the next analytical step should test the hypothesis rather than celebrate the ranking.
For now, every ICB has two questions worth asking. Who is missing from appropriate treatment, and what part of our pathway makes it hard to find, offer and safely continue it?
Methods and caveats
The analysis used the published England- and ICB-level CSV extracts from CVDPREVENT for patients registered in England to March 2026. Regional estimates are numerator and denominator-weighted aggregates of the 42 ICBs in force for the release. Published counts are disclosure-rounded to multiples of five, so regional values calculated from them may differ slightly from results calculated on unsuppressed counts. Percentages and ranks are unadjusted.
Age-band rates use the published 18 to 39, 40 to 59, 60 to 79, and 80 and over strata. For the sex comparison, female and male age-specific rates were directly standardised to the England persons denominator across those four bands. For the geographic sensitivity analysis, every ICB was directly standardised to the same England age mix. A small number of suppressed 18 to 39 cells in the heart-failure measures were excluded and the remaining age weights were rescaled for that ICB.
The new SGLT2 and four-pillar indicators have no comparable prior-year observation in the published extract, so the related 2025 to 2026 process measures are reported separately rather than as a trend in the featured indicators. Correlations are Spearman rank correlations across the 42 ICBs and are descriptive, ecological associations. Policy examples were selected because they were public, operationally specific and plausibly active before or during the measurement period. Their presence does not demonstrate impact. Trial endpoints, populations and follow-up differ, so effect estimates should not be compared as if they measured a single outcome.
Where this leads
Datim-QI exists to make this kind of question answerable for a single practice or PCN rather than only at ICB level: which patients sit inside the audit denominator without recorded treatment, which of them are already declined or contraindicated, and where the case-finding work is worth doing next.
This is an analysis of published aggregate data, not clinical advice. It does not establish causation and does not describe what happened to any individual patient. Happy to share the underlying data with anyone who wants to pick it apart.